| 2026-03-31 08:10:41+08:00 |
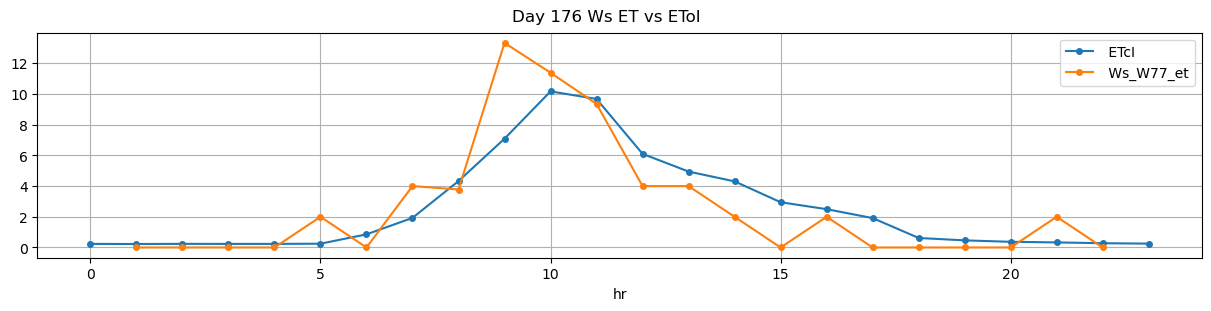
176 |
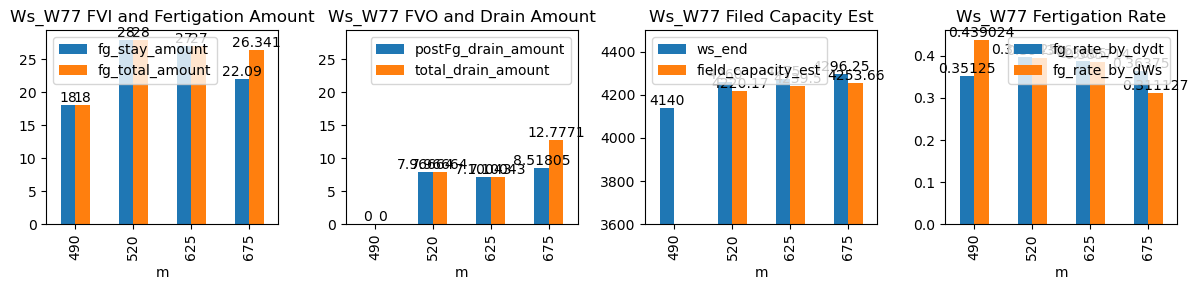
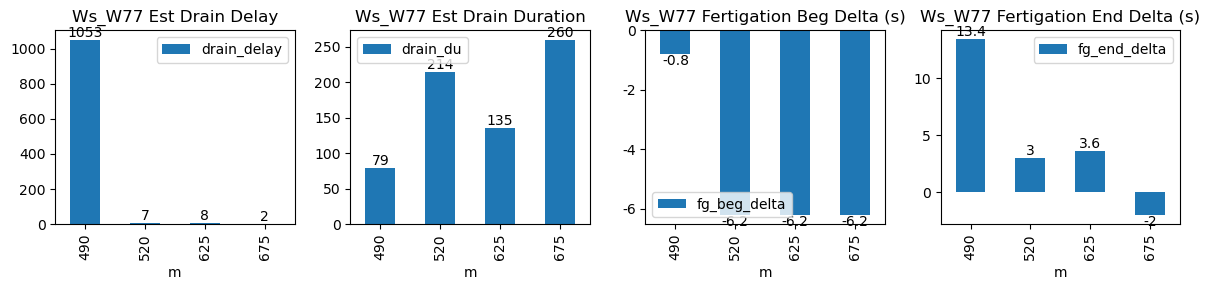
490 |
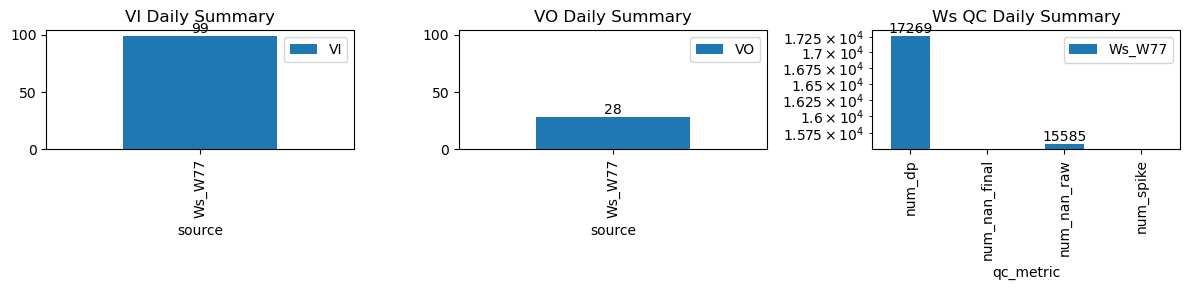
Ws_W77 |
2.993084 |
28.416667 |
490.68 |
490.666667 |
491.36 |
491.583333 |
4050.0 |
4140.00 |
41 |
-0.004344 |
-0.085185 |
0.000000 |
0.351250 |
0.439024 |
18.00 |
True |
-0.8 |
13.4 |
18.000 |
0.000000 |
0.000000 |
0.000000 |
79 |
1053 |
-0.109421 |
NaN |
| 2026-03-31 08:40:01+08:00 |
176 |
520 |
Ws_W77 |
2.993084 |
30.000000 |
520.02 |
519.916667 |
521.20 |
521.250000 |
4120.0 |
4260.00 |
71 |
-0.049228 |
0.000000 |
-0.060494 |
0.398125 |
0.394366 |
28.00 |
True |
-6.2 |
3.0 |
28.000 |
0.000000 |
7.966636 |
7.966636 |
214 |
7 |
-0.494641 |
4220.166821 |
| 2026-03-31 10:25:01+08:00 |
176 |
625 |
Ws_W77 |
2.993084 |
30.000000 |
625.02 |
624.916667 |
626.19 |
626.250000 |
4140.0 |
4275.00 |
70 |
-0.098308 |
-0.079321 |
-0.103086 |
0.388500 |
0.385714 |
27.00 |
True |
-6.2 |
3.6 |
27.000 |
0.000000 |
7.100427 |
7.100427 |
135 |
8 |
-0.030817 |
4239.497864 |
| 2026-03-31 11:15:01+08:00 |
176 |
675 |
Ws_W77 |
2.993084 |
30.000000 |
675.02 |
674.916667 |
676.20 |
676.166667 |
4185.8 |
4296.25 |
71 |
-0.108365 |
-0.107870 |
-0.014815 |
0.363750 |
0.311127 |
22.09 |
True |
-6.2 |
-2.0 |
26.341 |
4.259027 |
8.518053 |
12.777080 |
260 |
2 |
-0.117480 |
4253.659734 |