| 2026-04-01 08:10:00+08:00 |
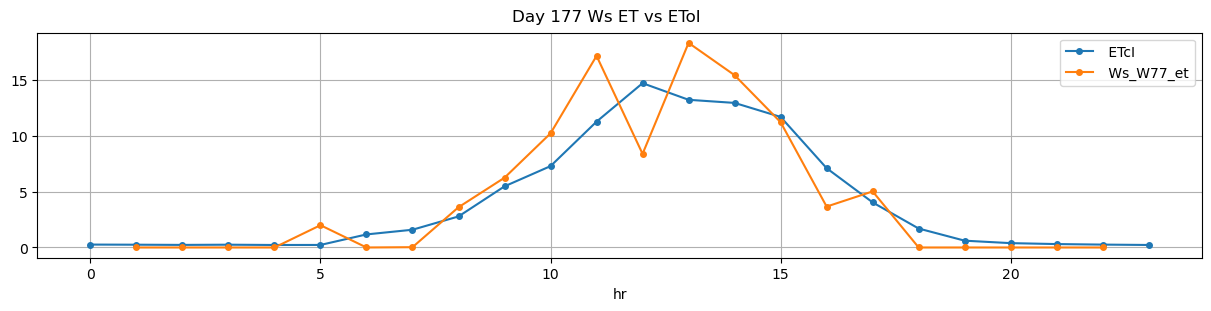
177 |
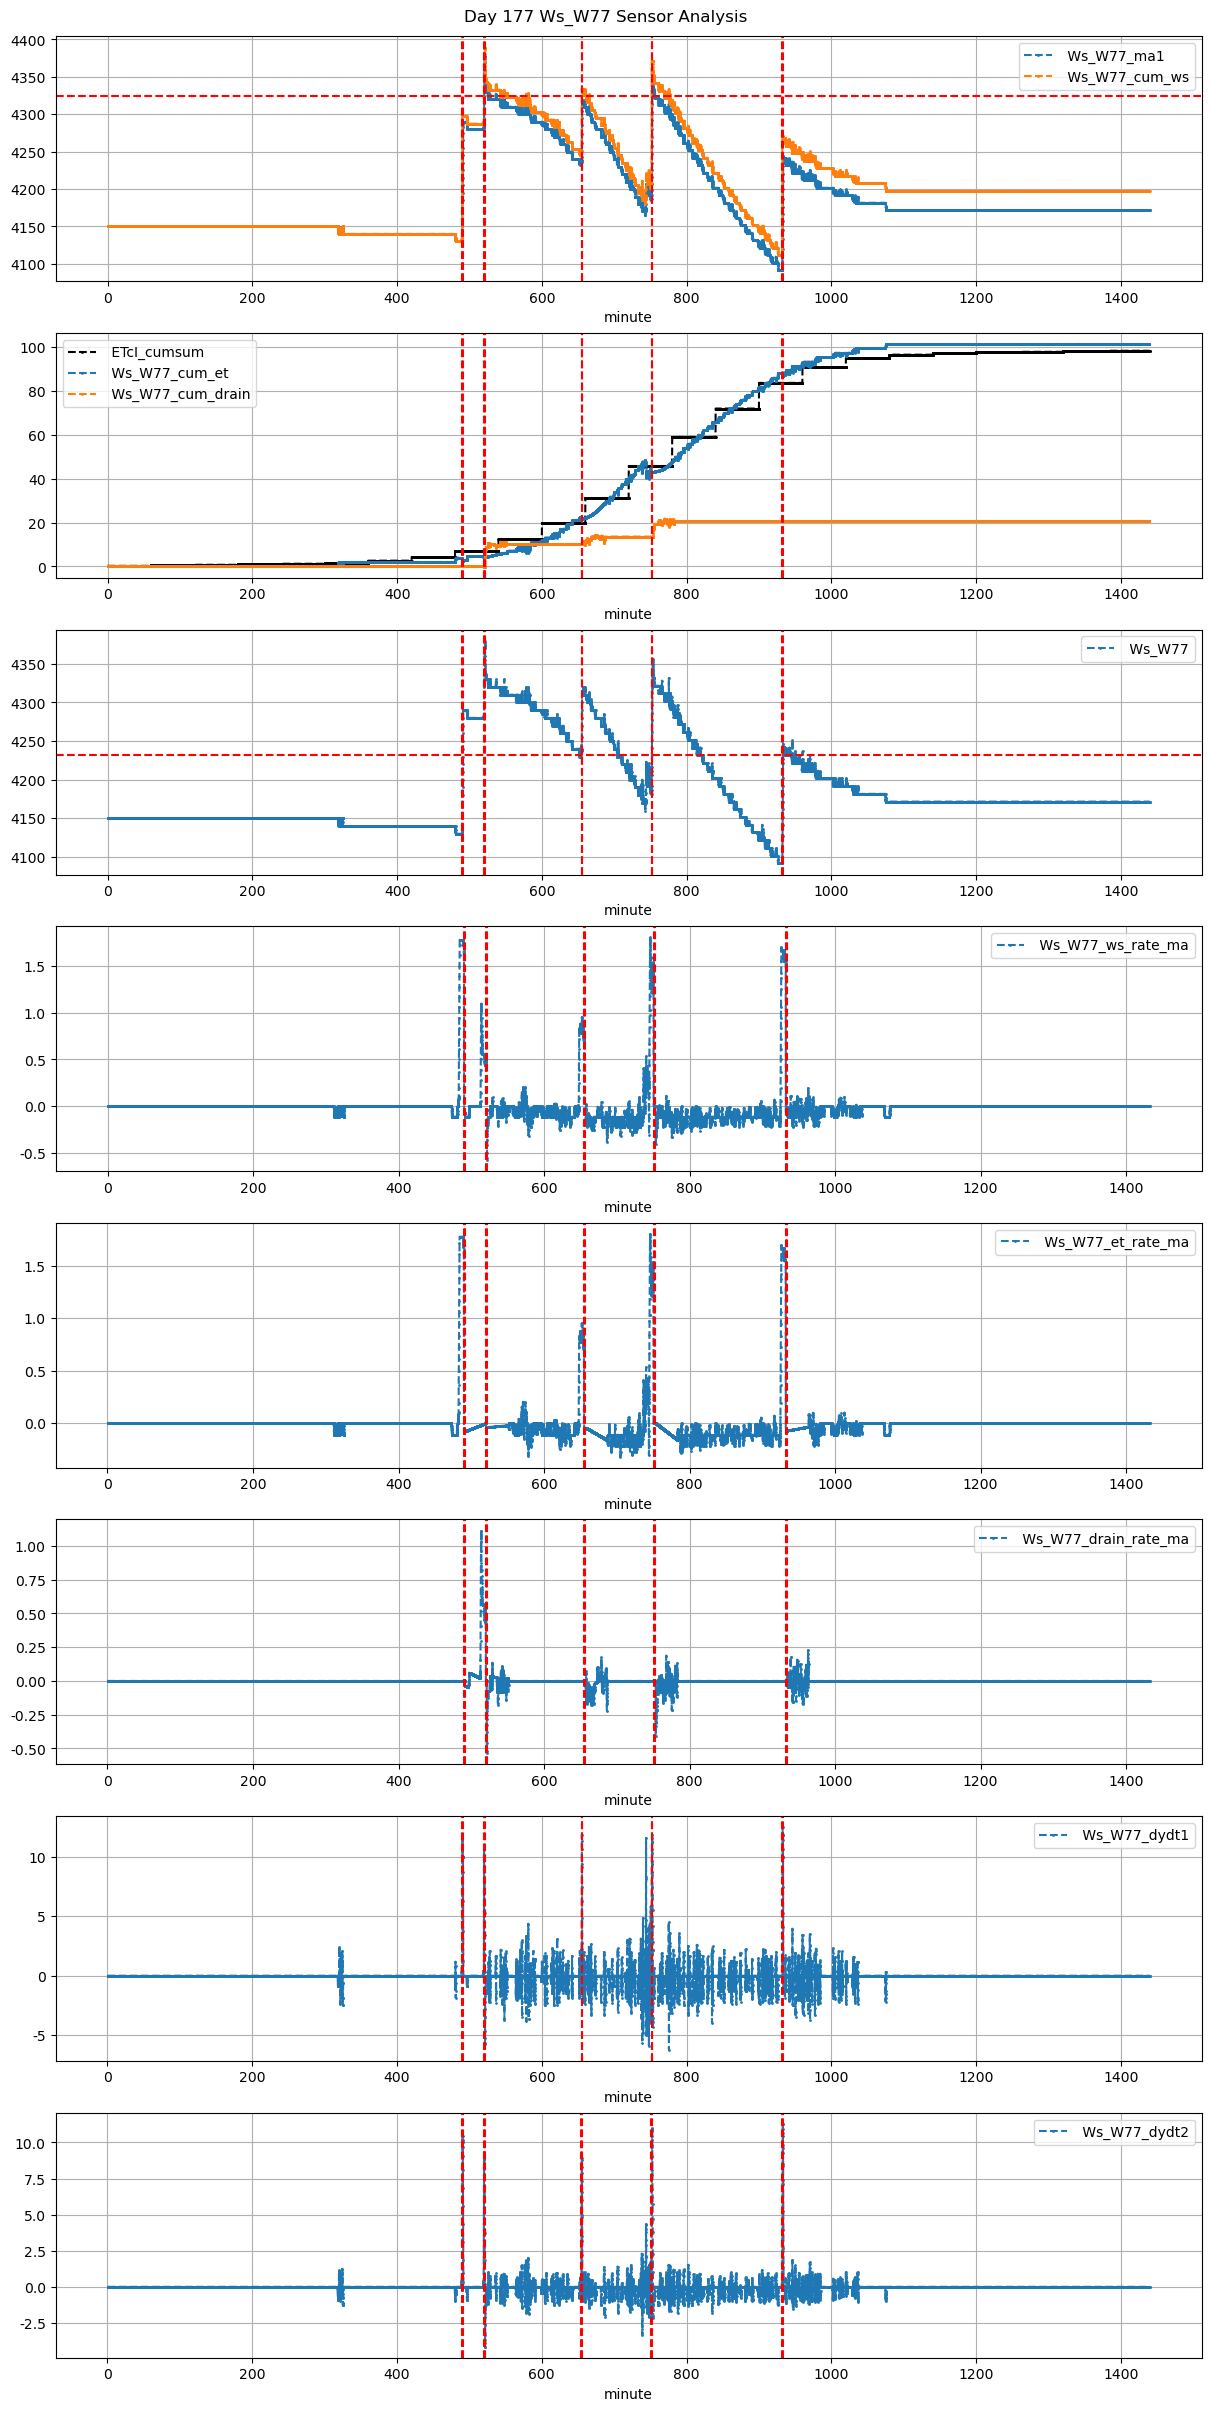
490 |
Ws_W77 |
2.070726 |
28.75 |
490.00 |
489.916667 |
491.18 |
491.250000 |
4130.000000 |
4290.000000 |
71 |
-0.003803 |
-0.152525 |
0.000000 |
0.405000 |
0.450704 |
32.000000 |
True |
-5.0 |
4.2 |
32.000000 |
0.000000 |
0.000000 |
0.0000 |
25 |
339 |
-0.906021 |
NaN |
| 2026-04-01 08:40:00+08:00 |
177 |
520 |
Ws_W77 |
2.070726 |
30.00 |
520.00 |
520.000000 |
521.18 |
521.083333 |
4280.000000 |
4380.000000 |
71 |
0.000000 |
-0.177160 |
-0.025000 |
0.351154 |
0.281690 |
20.000000 |
True |
0.0 |
-5.8 |
29.181000 |
5.684167 |
11.368333 |
17.0525 |
90 |
9 |
-3.654878 |
4323.158333 |
| 2026-04-01 10:55:00+08:00 |
177 |
655 |
Ws_W77 |
2.070726 |
30.00 |
655.00 |
655.000000 |
655.67 |
657.083333 |
4234.714286 |
4320.000000 |
40 |
-0.045763 |
-0.130305 |
-0.166590 |
0.263068 |
0.426429 |
17.057143 |
True |
0.0 |
84.8 |
17.057143 |
0.000000 |
0.000000 |
0.0000 |
15 |
234 |
-2.141423 |
NaN |
| 2026-04-01 12:31:38+08:00 |
177 |
751 |
Ws_W77 |
2.070726 |
30.00 |
751.63 |
750.416667 |
752.83 |
753.333333 |
4192.500000 |
4353.214286 |
72 |
0.000000 |
-0.169339 |
-0.175694 |
0.387500 |
0.446429 |
32.142857 |
True |
-72.8 |
30.2 |
32.142857 |
0.000000 |
0.000000 |
0.0000 |
20 |
55 |
-2.391410 |
NaN |
| 2026-04-01 15:32:13+08:00 |
177 |
932 |
Ws_W77 |
2.070726 |
30.00 |
932.22 |
932.166667 |
933.39 |
933.500000 |
4092.500000 |
4247.500000 |
70 |
-0.139124 |
-0.075000 |
-0.021759 |
0.423438 |
0.442857 |
31.000000 |
True |
-3.2 |
6.6 |
31.000000 |
0.000000 |
0.000000 |
0.0000 |
19 |
1016 |
-2.490609 |
NaN |