| 2026-04-06 08:20:01+08:00 |
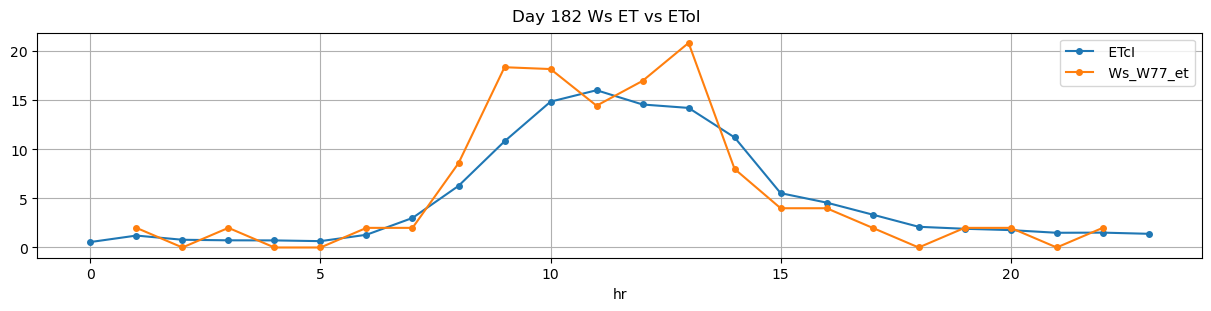
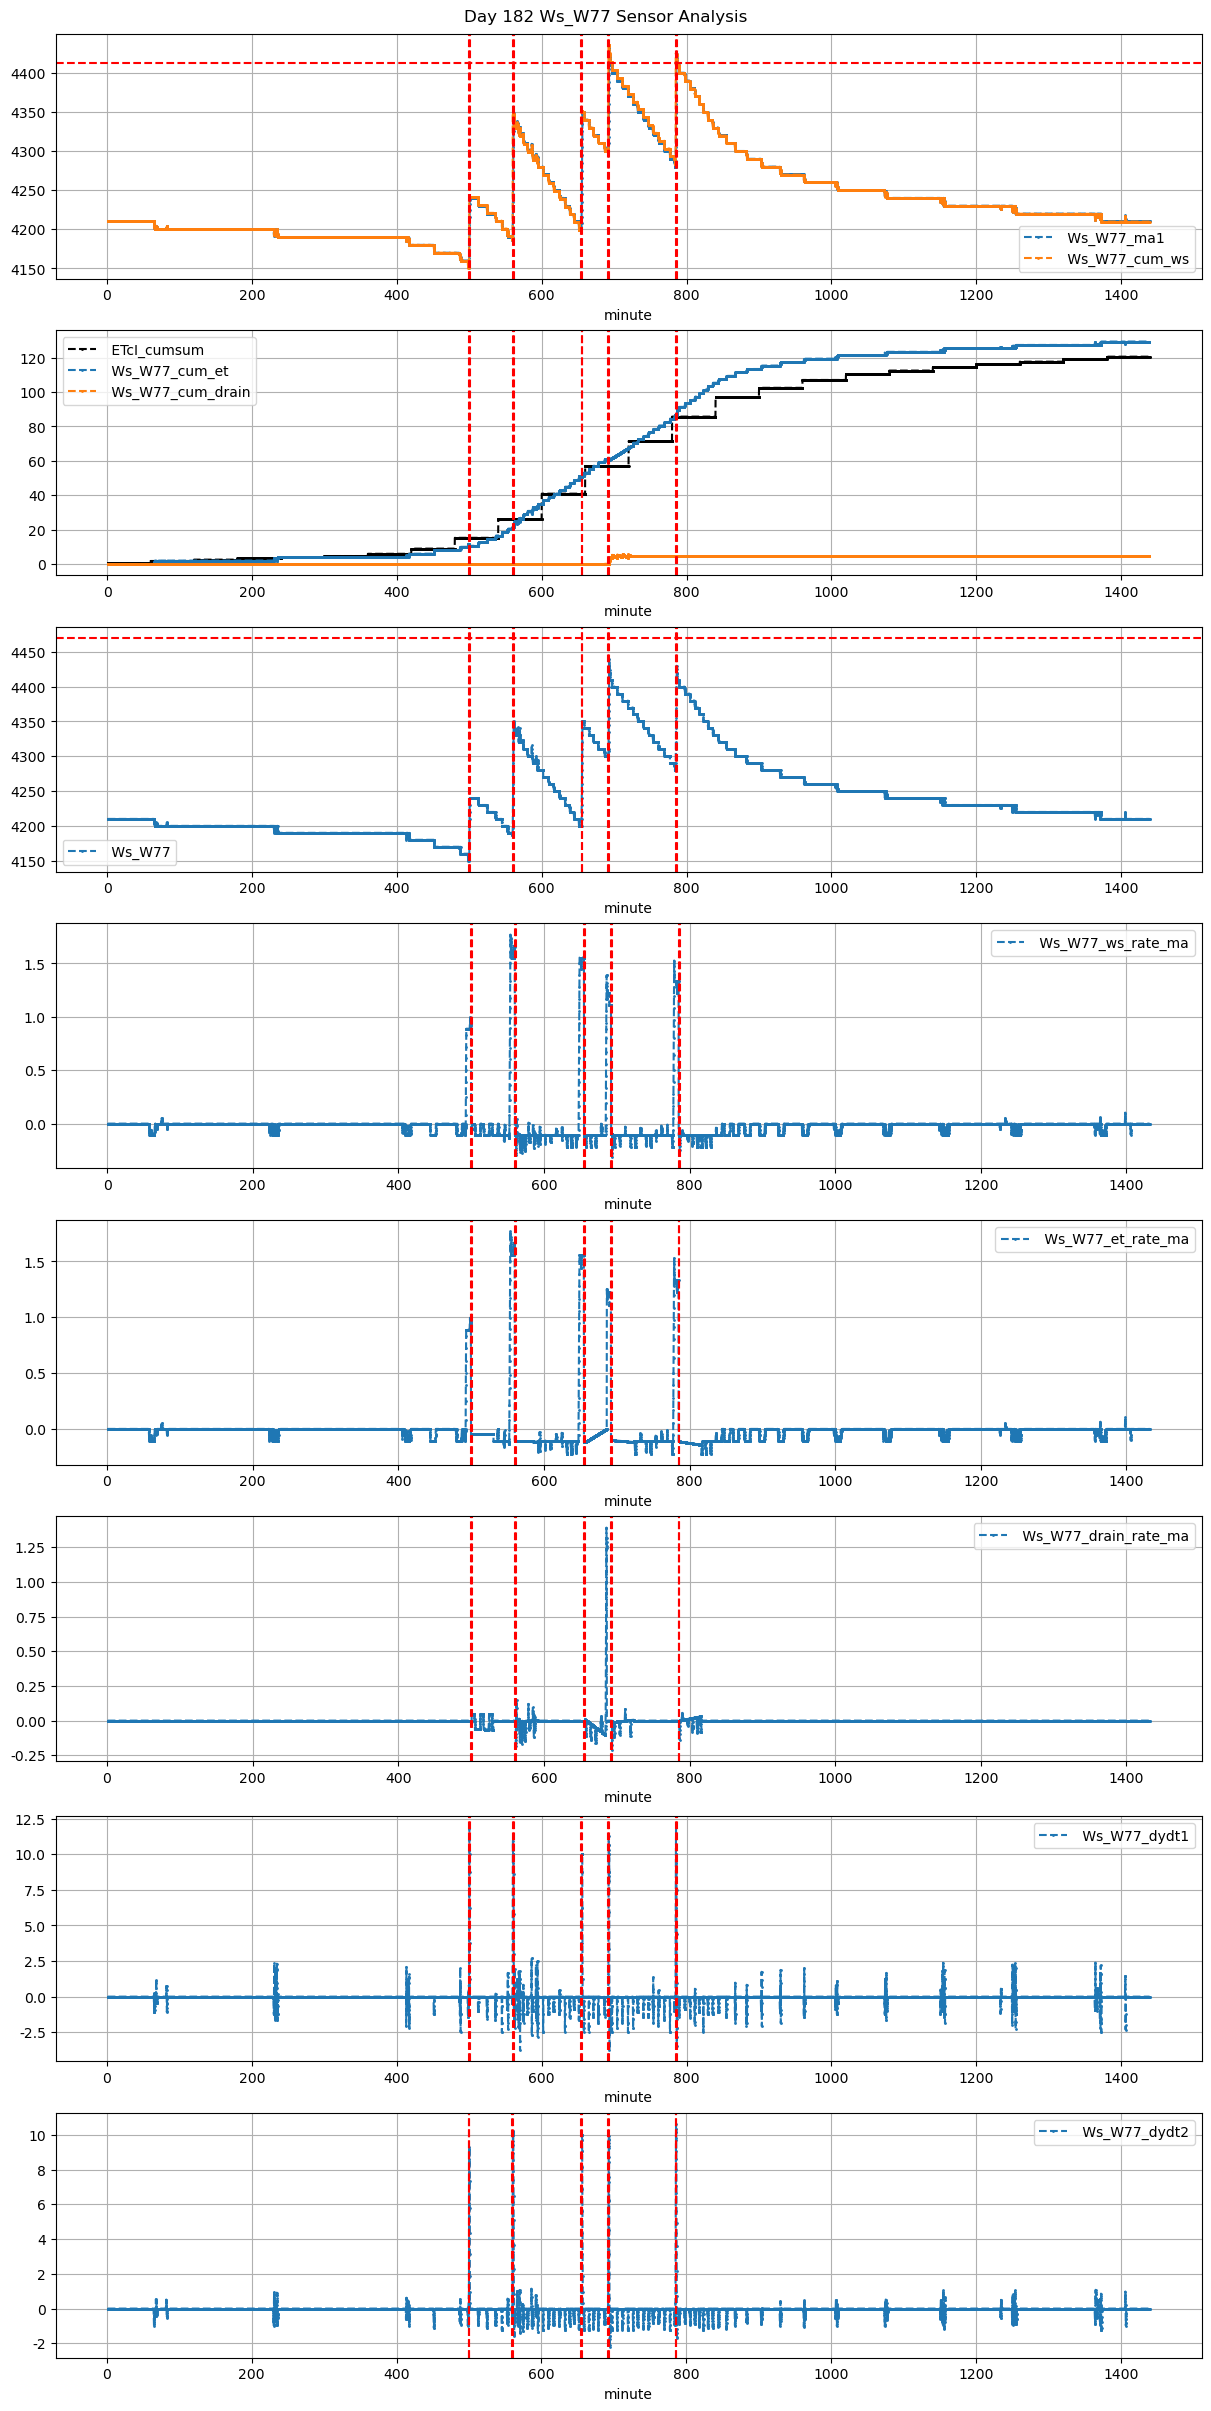
182 |
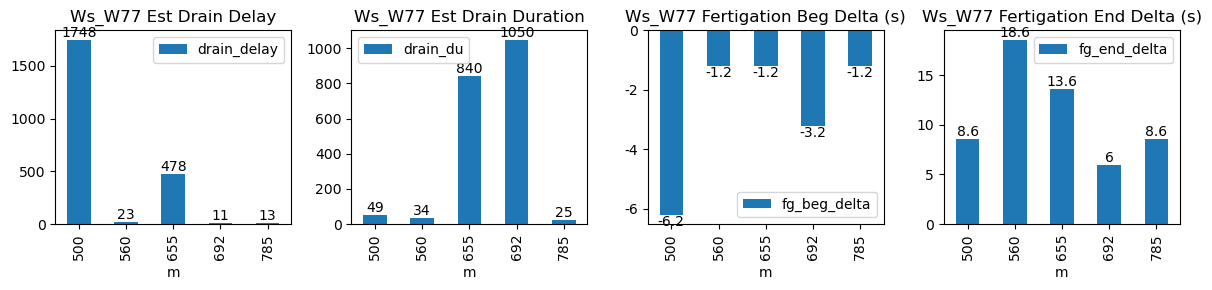
500 |
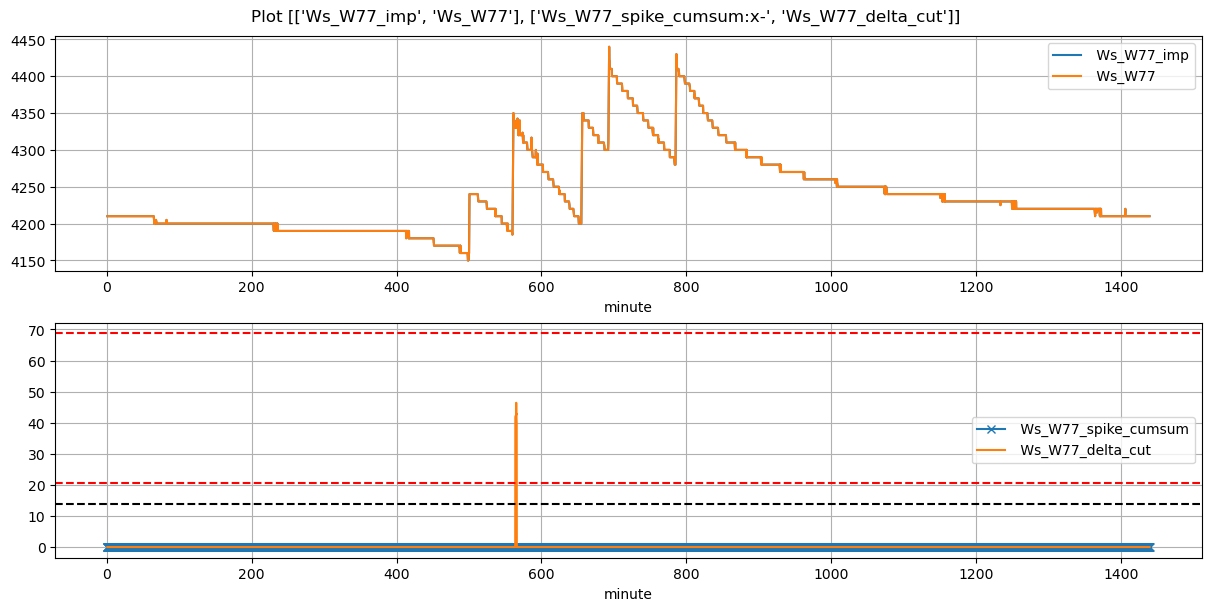
Ws_W77 |
1.784316 |
30 |
500.02 |
499.916667 |
500.69 |
500.666667 |
4154.10989 |
4240.0 |
40 |
-0.038407 |
0.000000 |
0.000000 |
0.349423 |
0.429451 |
17.178022 |
True |
-6.2 |
-1.4 |
17.447948 |
0.0 |
0 |
0.0 |
24 |
1428 |
-1.432292 |
NaN |
| 2026-04-06 09:20:01+08:00 |
182 |
560 |
Ws_W77 |
1.784316 |
30 |
560.02 |
560.000000 |
561.19 |
561.333333 |
4190.00000 |
4350.0 |
70 |
-0.100282 |
-0.103356 |
-0.082870 |
0.402500 |
0.457143 |
32.000000 |
True |
-1.2 |
8.6 |
32.000000 |
0.0 |
0 |
0.0 |
10 |
418 |
-2.090889 |
NaN |
| 2026-04-06 10:55:01+08:00 |
182 |
655 |
Ws_W77 |
1.784316 |
30 |
655.02 |
655.000000 |
656.19 |
656.250000 |
4200.00000 |
4350.0 |
70 |
-0.127119 |
-0.099306 |
-0.149444 |
0.400000 |
0.428571 |
30.000000 |
True |
-1.2 |
3.6 |
30.533908 |
0.0 |
0 |
0.0 |
20 |
118 |
-2.160070 |
NaN |
| 2026-04-06 11:32:13+08:00 |
182 |
692 |
Ws_W77 |
1.784316 |
30 |
692.22 |
692.166667 |
693.40 |
693.416667 |
4300.00000 |
4440.0 |
71 |
-0.148305 |
-0.163889 |
-0.097222 |
0.381250 |
0.394366 |
28.000000 |
True |
-3.2 |
1.0 |
30.970107 |
0.0 |
0 |
0.0 |
54 |
11 |
-2.395663 |
NaN |
| 2026-04-06 13:05:01+08:00 |
182 |
785 |
Ws_W77 |
1.784316 |
30 |
785.02 |
785.000000 |
786.19 |
786.250000 |
4280.00000 |
4430.0 |
70 |
-0.120056 |
-0.134722 |
-0.134444 |
0.406250 |
0.428571 |
30.000000 |
True |
-1.2 |
3.6 |
30.533908 |
0.0 |
0 |
0.0 |
35 |
13 |
-2.047311 |
NaN |