| 2026-04-12 08:14:24+08:00 |
188 |
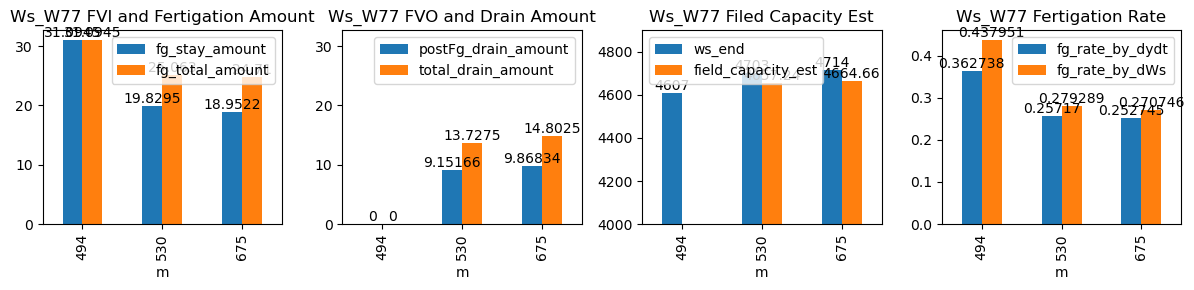
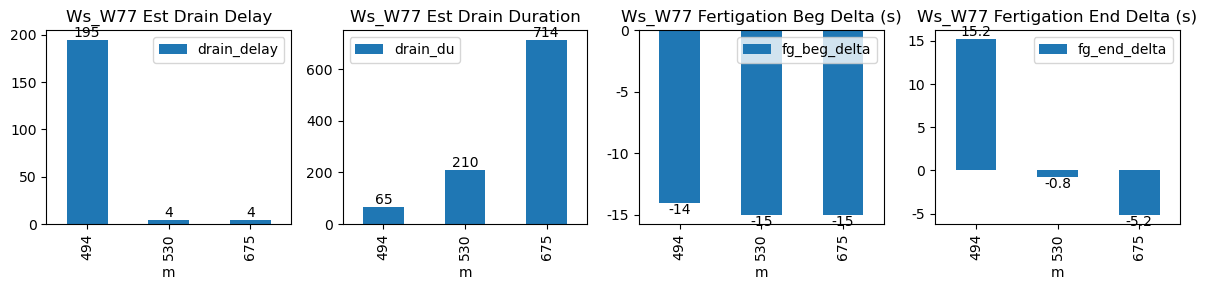
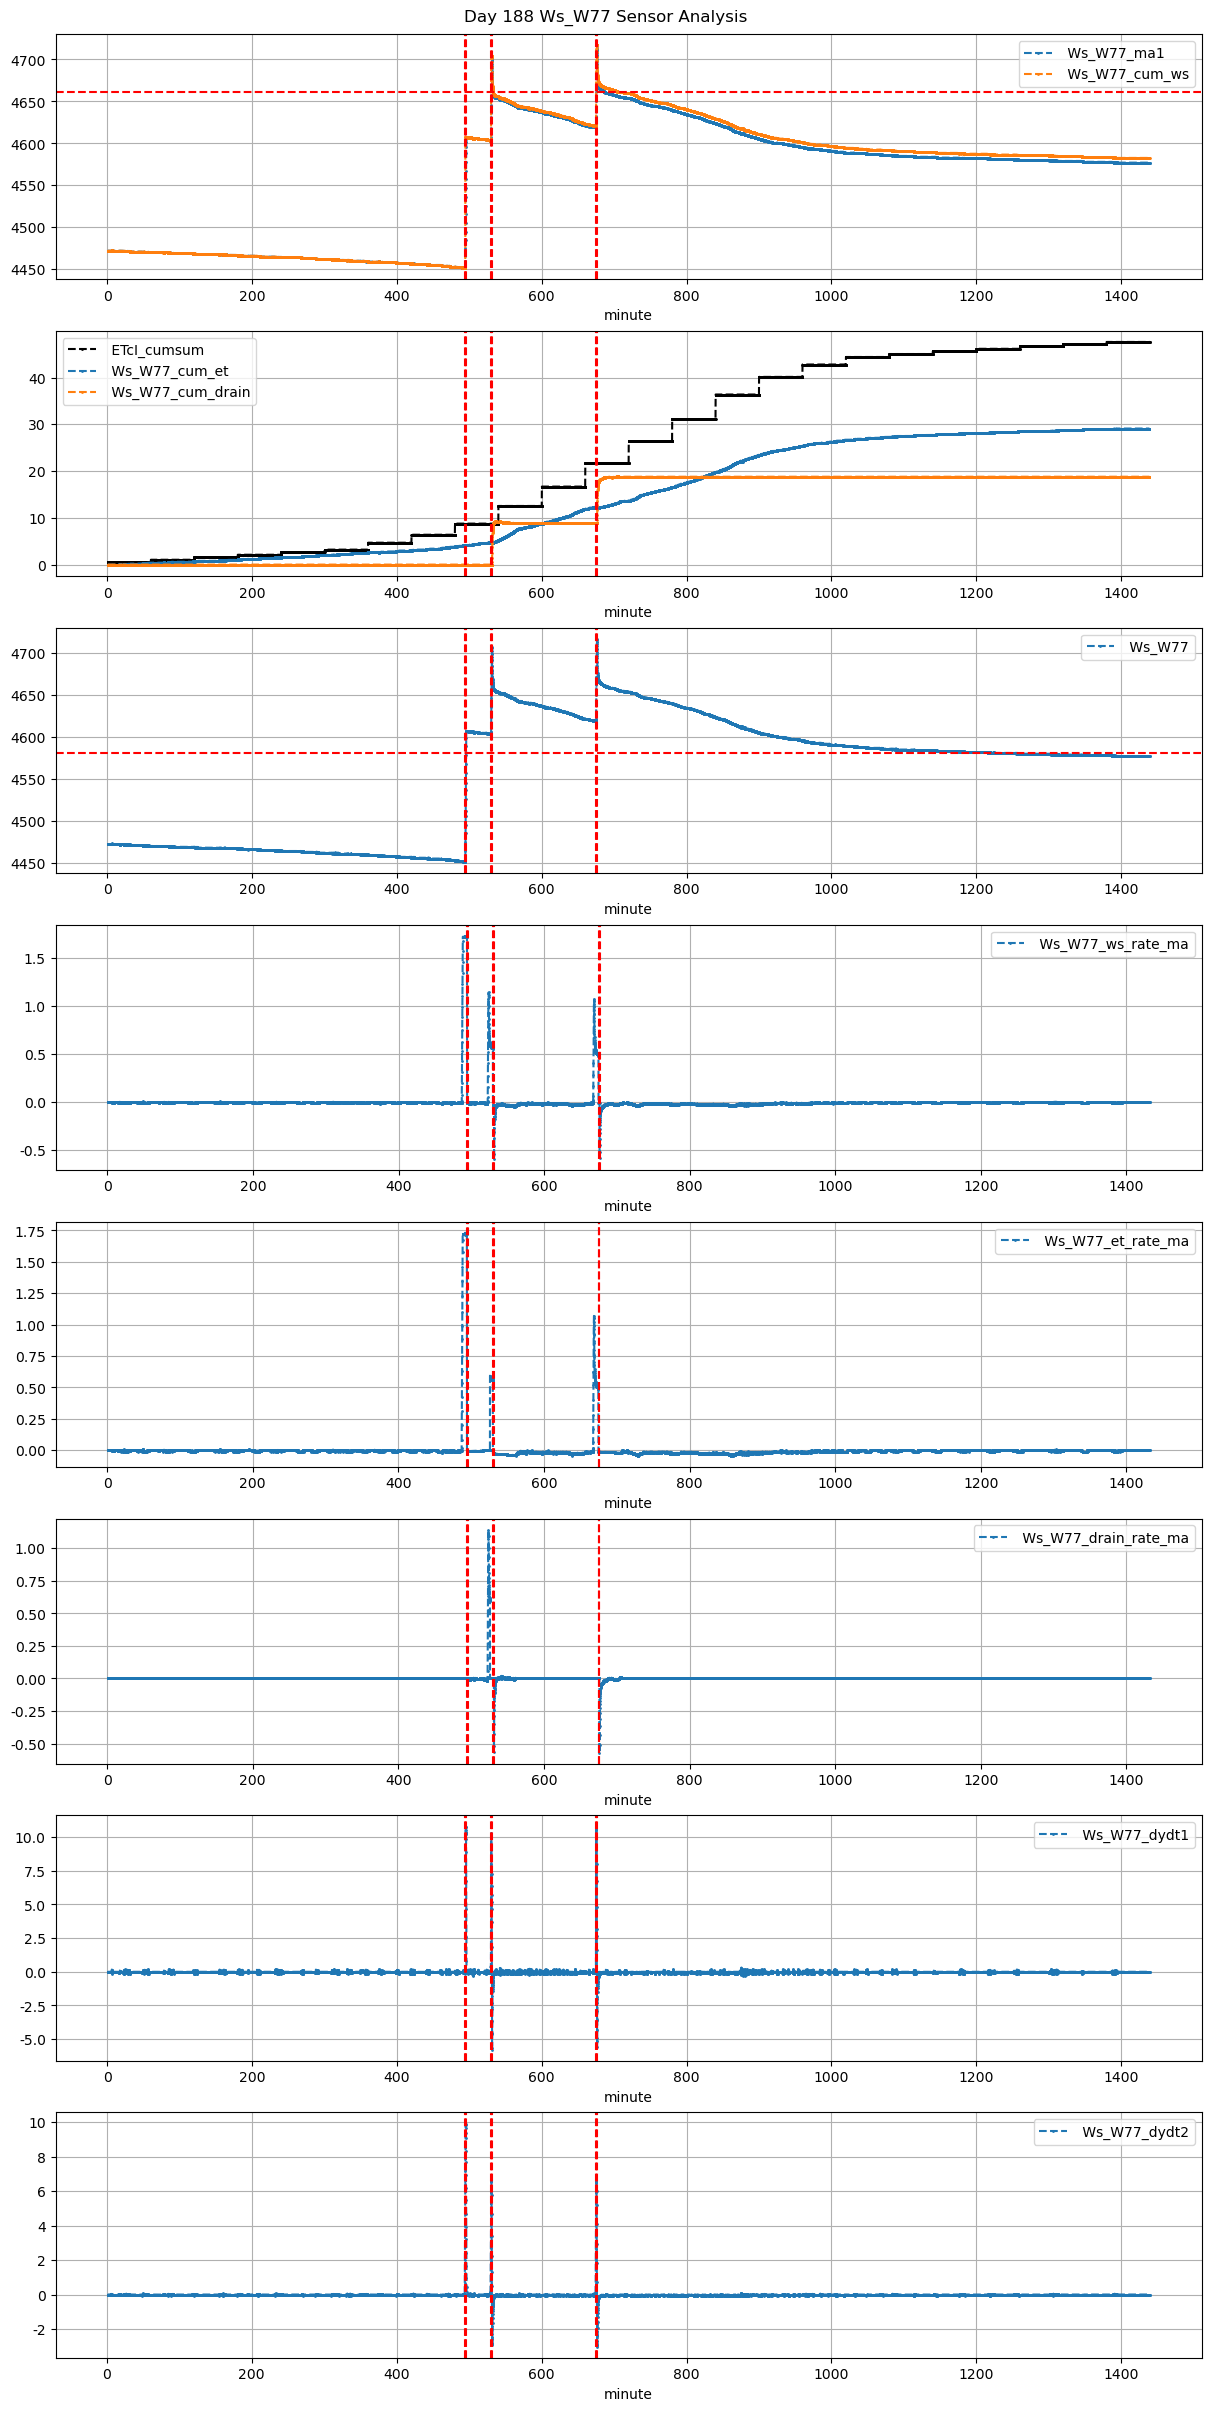
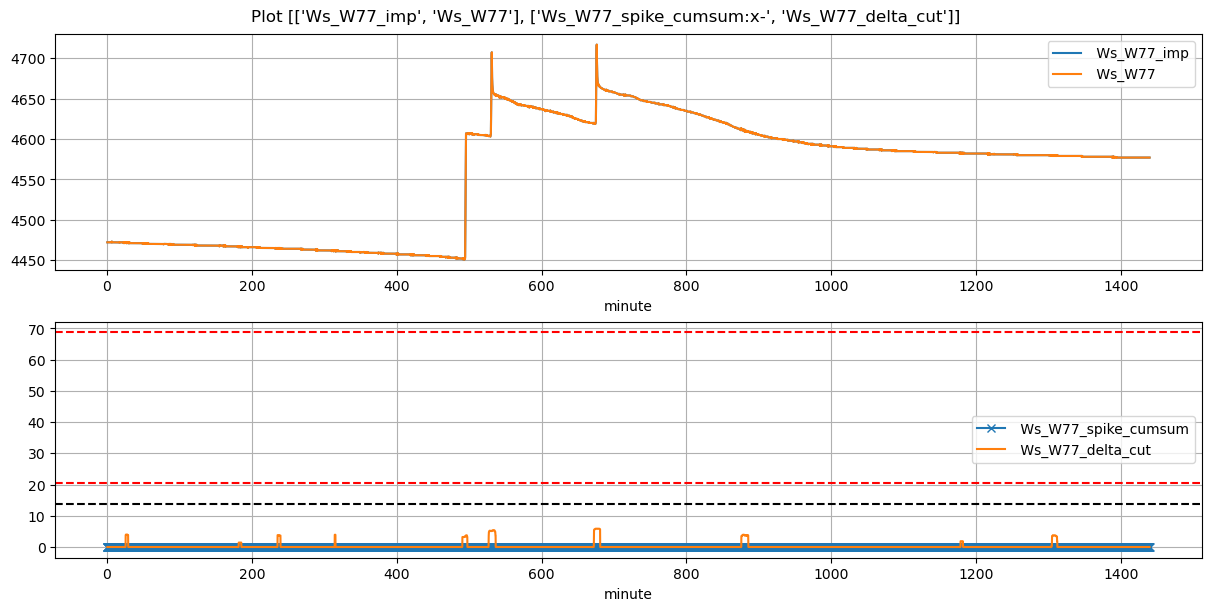
494 |
Ws_W77 |
0.770376 |
30 |
494.4 |
494.166667 |
495.58 |
495.833333 |
4451.527273 |
4607.0 |
71 |
-0.007407 |
-0.009371 |
0.000000 |
0.362738 |
0.437951 |
31.094545 |
True |
-14.0 |
15.2 |
31.094545 |
0.000000 |
0.000000 |
0.000000 |
65 |
195 |
-0.013684 |
NaN |
| 2026-04-12 08:50:00+08:00 |
188 |
530 |
Ws_W77 |
0.770376 |
30 |
530.0 |
529.750000 |
531.18 |
531.166667 |
4603.852273 |
4703.0 |
71 |
-0.026198 |
-0.071924 |
-0.039599 |
0.257170 |
0.279289 |
19.829545 |
True |
-15.0 |
-0.8 |
25.063000 |
4.575828 |
9.151657 |
13.727485 |
210 |
4 |
-0.145127 |
4657.241716 |
| 2026-04-12 11:15:00+08:00 |
188 |
675 |
Ws_W77 |
0.770376 |
30 |
675.0 |
674.750000 |
676.17 |
676.083333 |
4619.238889 |
4714.0 |
70 |
-0.011097 |
-0.084210 |
-0.021512 |
0.252745 |
0.270746 |
18.952222 |
True |
-15.0 |
-5.2 |
24.710000 |
4.934170 |
9.868339 |
14.802509 |
714 |
4 |
-0.087335 |
4664.658303 |