| 2026-04-14 07:42:13+08:00 |
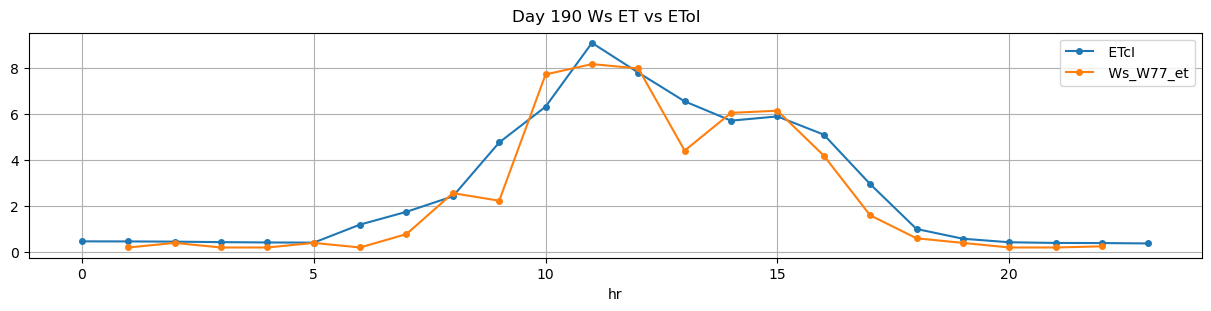
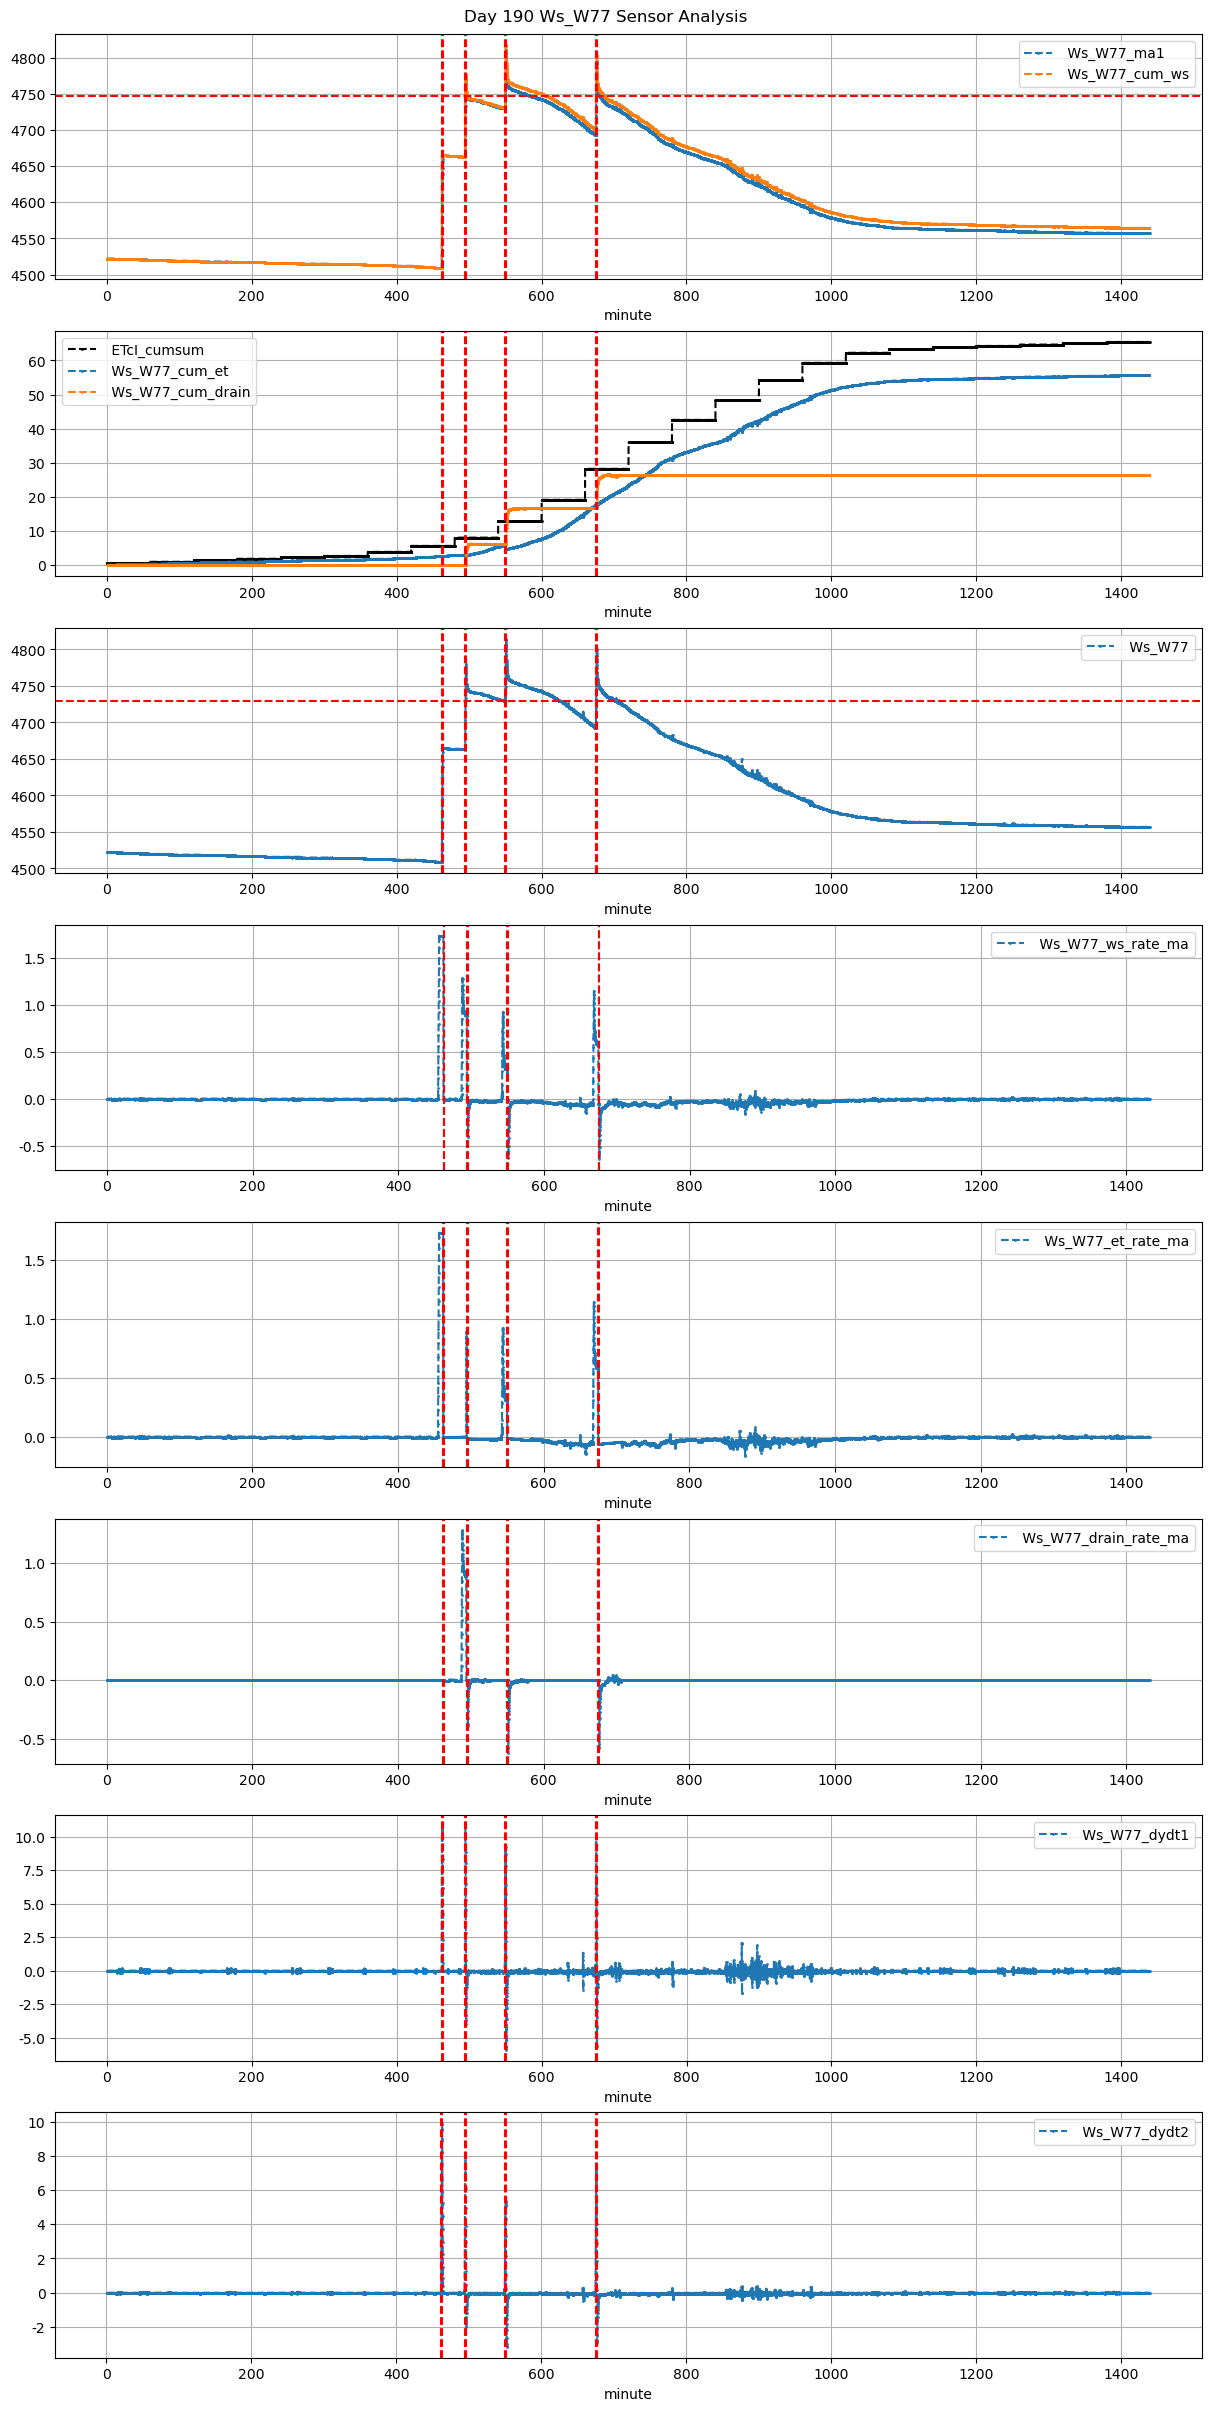
190 |
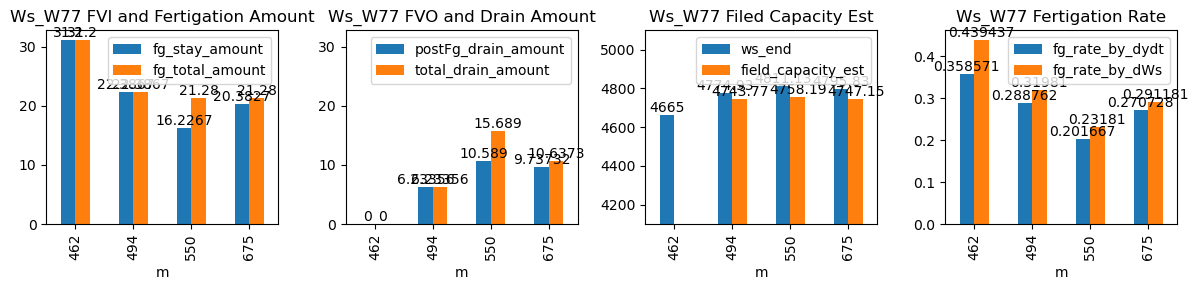
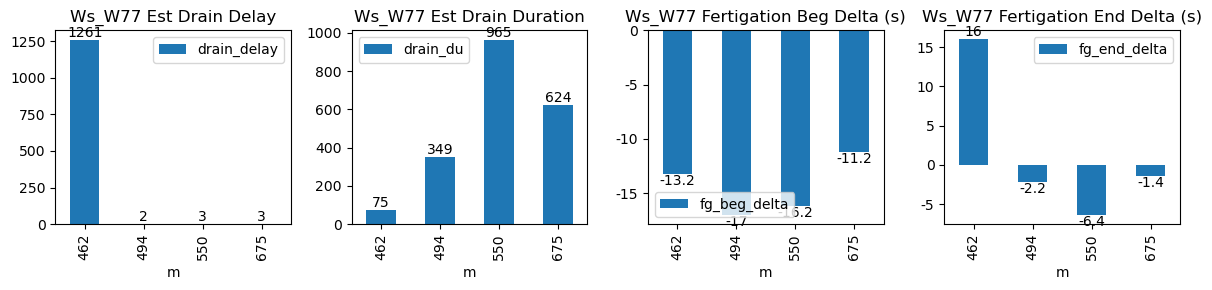
462 |
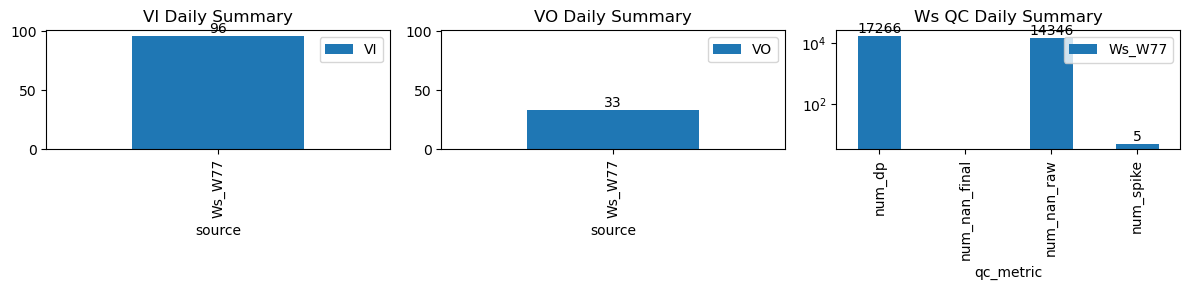
Ws_W77 |
0.79035 |
30 |
462.22 |
462.000000 |
463.40 |
463.666667 |
4509.00 |
4665.000000 |
71 |
-0.007865 |
-0.009527 |
0.000000 |
0.358571 |
0.439437 |
31.200000 |
True |
-13.2 |
16.0 |
31.200000 |
0.0 |
0.000000 |
0.000000 |
75 |
1261 |
-0.008691 |
NaN |
| 2026-04-14 08:14:27+08:00 |
190 |
494 |
Ws_W77 |
0.79035 |
30 |
494.45 |
494.166667 |
495.62 |
495.583333 |
4663.00 |
4774.933333 |
70 |
-0.016841 |
-0.054043 |
-0.024321 |
0.288762 |
0.319810 |
22.386667 |
True |
-17.0 |
-2.2 |
22.386667 |
0.0 |
6.233565 |
6.233565 |
349 |
2 |
-0.077354 |
4743.765509 |
| 2026-04-14 09:10:01+08:00 |
190 |
550 |
Ws_W77 |
0.79035 |
30 |
550.02 |
549.750000 |
551.19 |
551.083333 |
4730.00 |
4811.133333 |
70 |
-0.014687 |
-0.091121 |
-0.032881 |
0.201667 |
0.231810 |
16.226667 |
True |
-16.2 |
-6.4 |
21.280000 |
5.1 |
10.588973 |
15.688973 |
965 |
3 |
-0.104394 |
4758.188466 |
| 2026-04-14 11:15:01+08:00 |
190 |
675 |
Ws_W77 |
0.79035 |
30 |
675.02 |
674.833333 |
676.19 |
676.166667 |
4693.92 |
4795.833333 |
70 |
-0.062070 |
-0.142068 |
-0.045239 |
0.270728 |
0.291181 |
20.382667 |
True |
-11.2 |
-1.4 |
21.280000 |
0.9 |
9.737321 |
10.637321 |
624 |
3 |
-0.164092 |
4747.146728 |