VI and VO Daily Summary
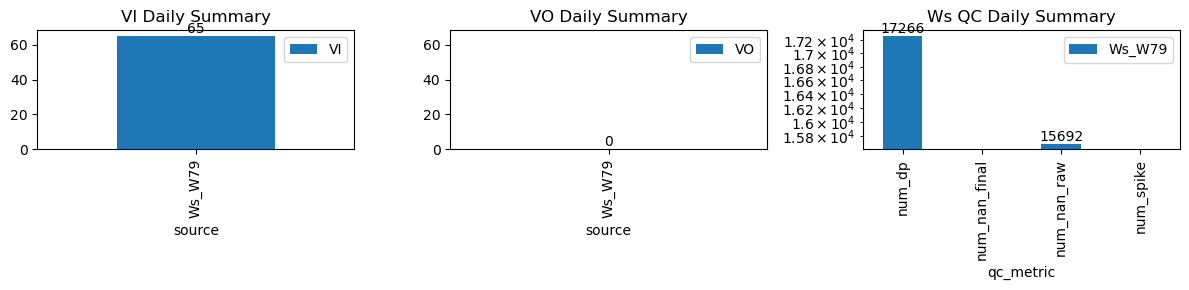
| ws_name | num_dp | num_nan_raw | num_nan_final | num_spike | cum_step_adj |
|---|---|---|---|---|---|
| Ws_W79 | 17,266 | 15,692 | 0 | 0 | 0.00 |
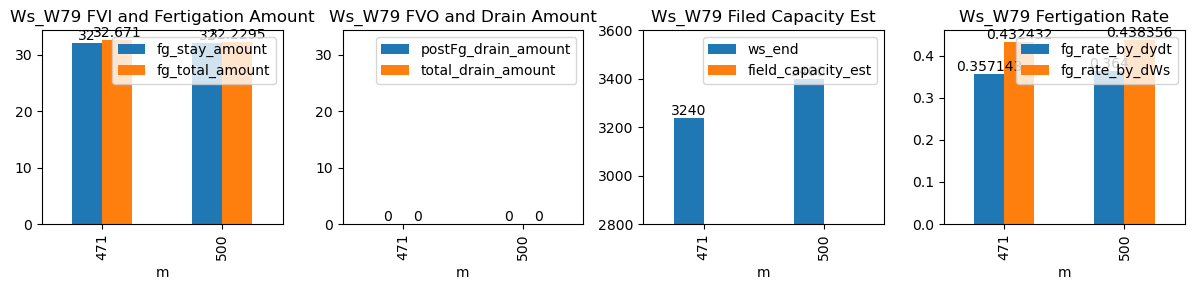
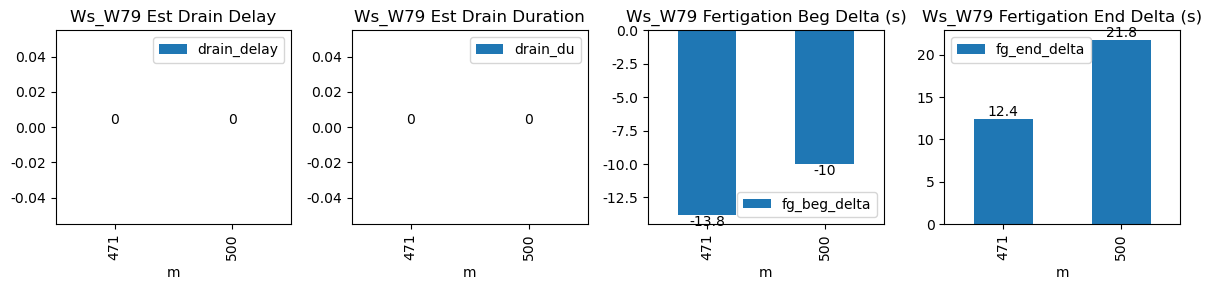
| ds | d | m | ws_name | prominence_cut | max_drain_du | fg_beg | fg_beg_est | fg_end | fg_end_est | ws_beg | ws_end | duc | pre_fg_et | post_fg_ws | post_drn_et | fg_rate_by_dydt | fg_rate_by_dWs | fg_stay_amount | enough_data | fg_beg_delta | fg_end_delta | fg_total_amount | fg_drain_amount | postFg_drain_amount | total_drain_amount | drain_du | drain_delay | drain_rate | field_capacity_est |
|---|---|---|---|---|---|---|---|---|---|---|---|---|---|---|---|---|---|---|---|---|---|---|---|---|---|---|---|---|---|
| 2026-02-27 07:51:14+08:00 | 144 | 471 | Ws_W79 | 1.143334 | 27.333333 | 471.23 | 471.000000 | 472.46 | 472.666667 | 3080.0 | 3240.0 | 74 | 0.000000 | 0.0 | 0.0 | 0.357143 | 0.432432 | 32.0 | True | -13.8 | 12.4 | 32.6710 | 0.0 | 0 | 0.0 | NaN | NaN | NaN | NaN |
| 2026-02-27 08:20:00+08:00 | 144 | 500 | Ws_W79 | 1.143334 | 30.000000 | 500.00 | 499.833333 | 501.22 | 501.583333 | 3240.0 | 3400.0 | 73 | -0.004843 | 0.0 | 0.0 | 0.364000 | 0.438356 | 32.0 | True | -10.0 | 21.8 | 32.2295 | 0.0 | 0 | 0.0 | NaN | NaN | NaN | NaN |