VI and VO Daily Summary
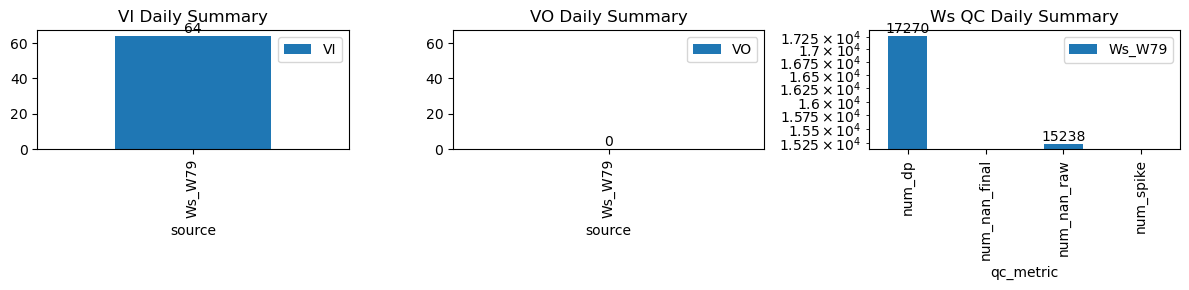
| ws_name | num_dp | num_nan_raw | num_nan_final | num_spike | cum_step_adj |
|---|---|---|---|---|---|
| Ws_W79 | 17,270 | 15,238 | 0 | 0 | 0.00 |
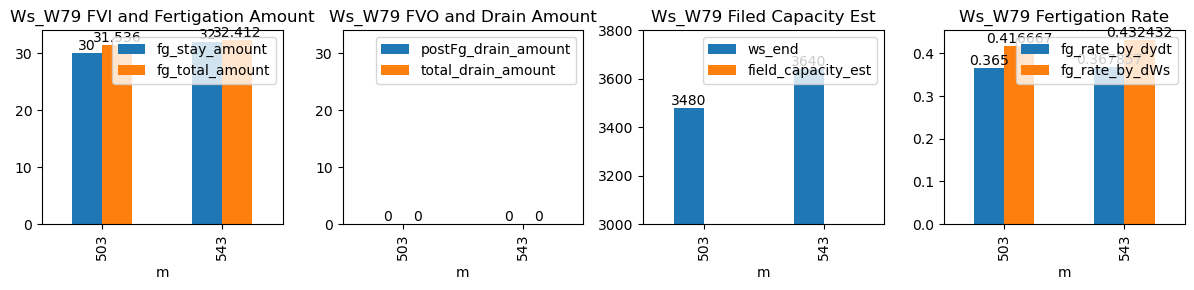
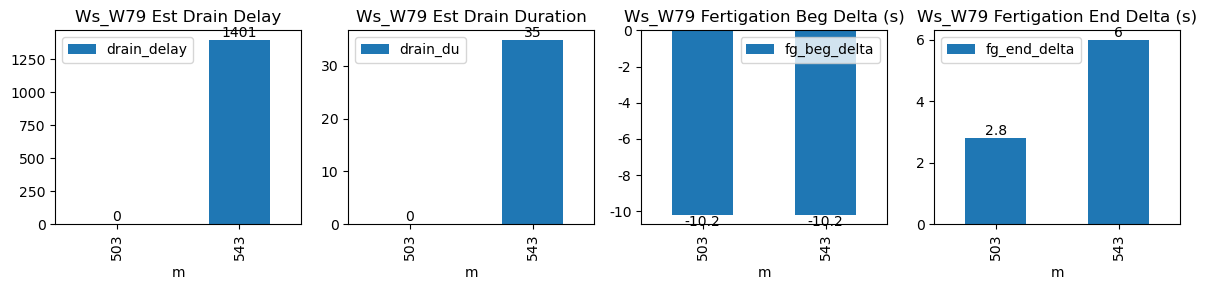
| ds | d | m | ws_name | prominence_cut | max_drain_du | fg_beg | fg_beg_est | fg_end | fg_end_est | ws_beg | ws_end | duc | pre_fg_et | post_fg_ws | post_drn_et | fg_rate_by_dydt | fg_rate_by_dWs | fg_stay_amount | enough_data | fg_beg_delta | fg_end_delta | fg_total_amount | fg_drain_amount | postFg_drain_amount | total_drain_amount | drain_du | drain_delay | drain_rate | field_capacity_est |
|---|---|---|---|---|---|---|---|---|---|---|---|---|---|---|---|---|---|---|---|---|---|---|---|---|---|---|---|---|---|
| 2026-02-28 08:23:40+08:00 | 145 | 503 | Ws_W79 | 0.937991 | 30 | 503.67 | 503.5 | 504.87 | 504.916667 | 3330.0 | 3480.0 | 72 | 0.0 | 0.0 | 0.0 | 0.366429 | 0.416667 | 30.0 | True | -10.2 | 2.8 | 31.536 | 0.0 | 0 | 0.0 | NaN | NaN | NaN | NaN |
| 2026-02-28 09:03:40+08:00 | 145 | 543 | Ws_W79 | 0.937991 | 30 | 543.67 | 543.5 | 544.90 | 545.000000 | 3480.0 | 3640.0 | 74 | 0.0 | 0.0 | 0.0 | 0.369286 | 0.432432 | 32.0 | True | -10.2 | 6.0 | 32.412 | 0.0 | 0 | 0.0 | 35.0 | 1401.0 | -1.111111 | NaN |