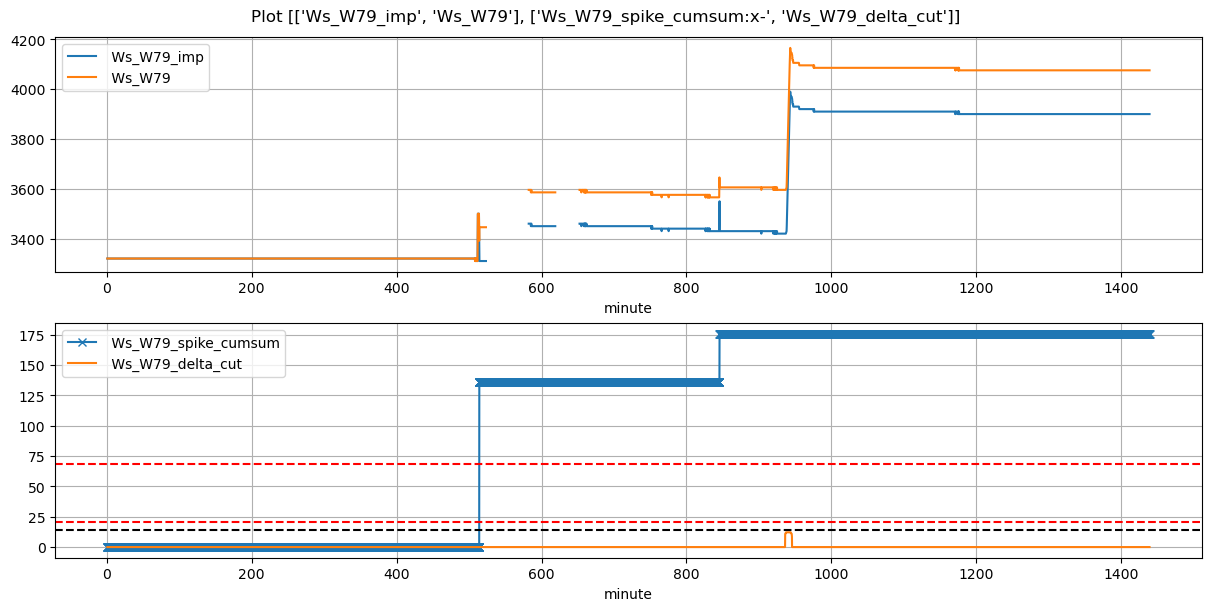
VI and VO Daily Summary
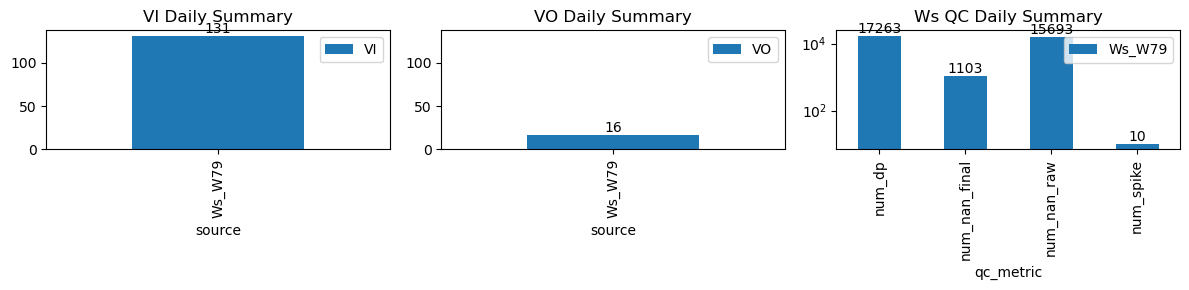
| ws_name | num_dp | num_nan_raw | num_nan_final | num_spike | cum_step_adj |
|---|---|---|---|---|---|
| Ws_W79 | 17,263 | 15,693 | 1,103 | 10 | 175.71 |
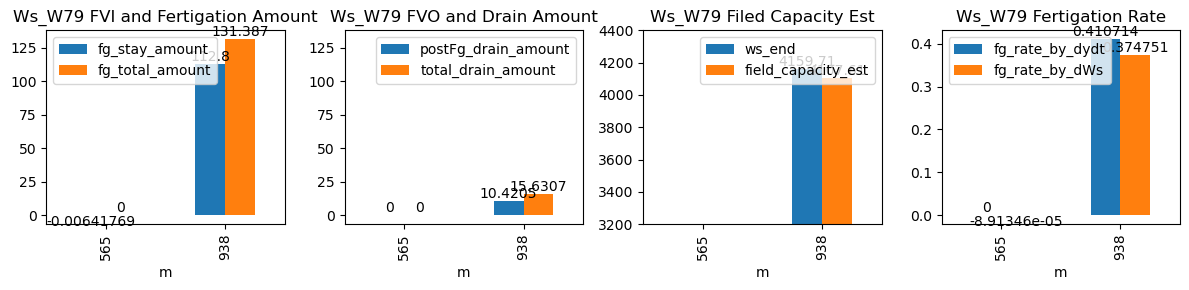
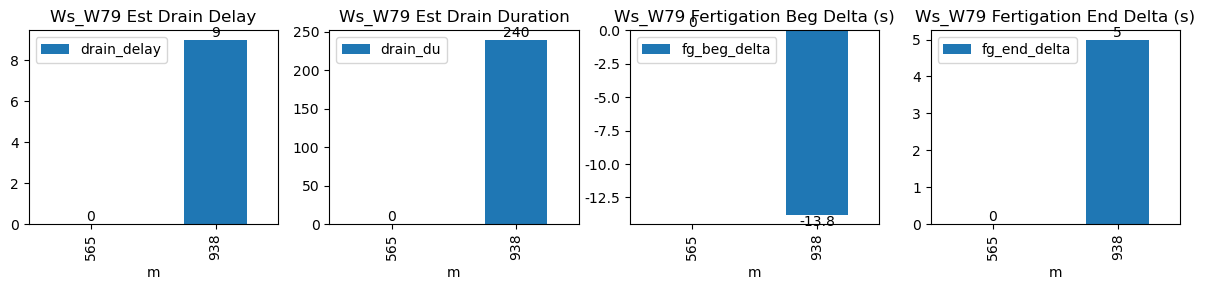
| ds | d | m | ws_name | prominence_cut | max_drain_du | fg_beg | fg_beg_est | fg_end | fg_end_est | ws_beg | ws_end | duc | pre_fg_et | post_fg_ws | post_drn_et | fg_rate_by_dydt | fg_rate_by_dWs | fg_stay_amount | enough_data | fg_beg_delta | fg_end_delta | fg_total_amount | fg_drain_amount | postFg_drain_amount | total_drain_amount | drain_du | drain_delay | drain_rate | field_capacity_est |
|---|---|---|---|---|---|---|---|---|---|---|---|---|---|---|---|---|---|---|---|---|---|---|---|---|---|---|---|---|---|
| 2026-03-01 09:25:41+08:00 | 146 | 565 | Ws_W79 | 2.745947 | 30 | 565.68 | NaN | 566.88 | 569.083333 | NaN | 3445.714286 | 72 | NaN | NaN | NaN | NaN | NaN | NaN | False | NaN | 132.2 | NaN | 0.0 | NaN | NaN | NaN | NaN | NaN | NaN |
| 2026-03-01 15:38:14+08:00 | 146 | 938 | Ws_W79 | 2.745947 | 30 | 938.23 | 938.0 | 943.25 | 943.333333 | 3595.714286 | 4165.714286 | 301 | 0.0 | -0.43125 | -0.075 | 0.410714 | 0.378738 | 114.0 | True | -13.8 | 5.0 | 131.3865 | 0.0 | 0.0 | 0.0 | 34.0 | 170.0 | -2.812655 | NaN |