| 2026-03-02 07:48:41+08:00 |
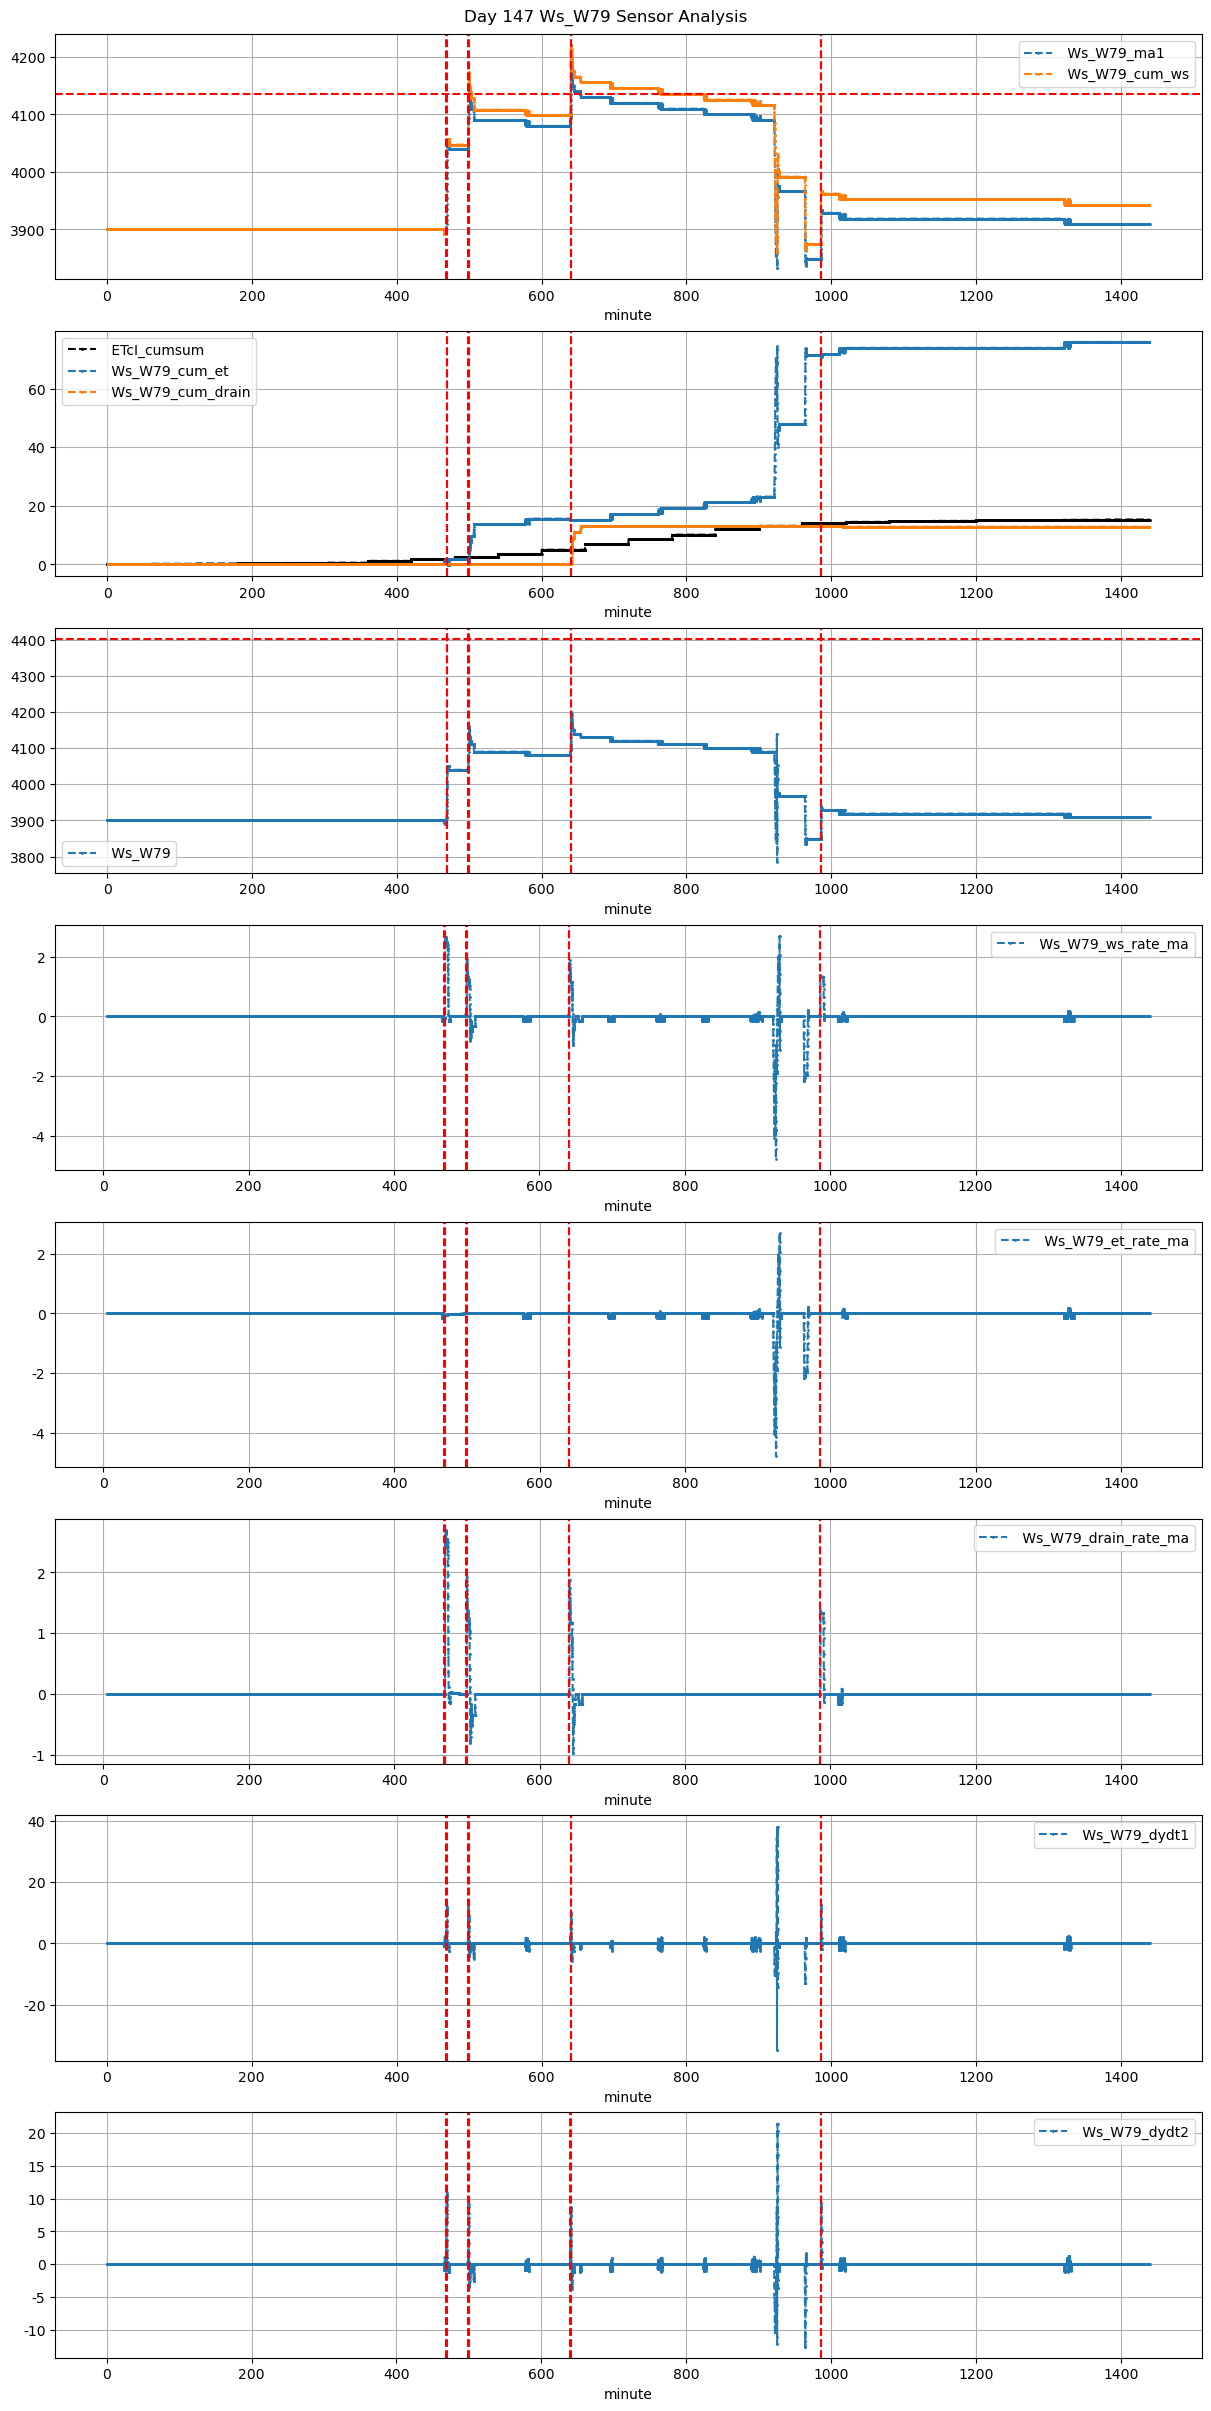
147 |
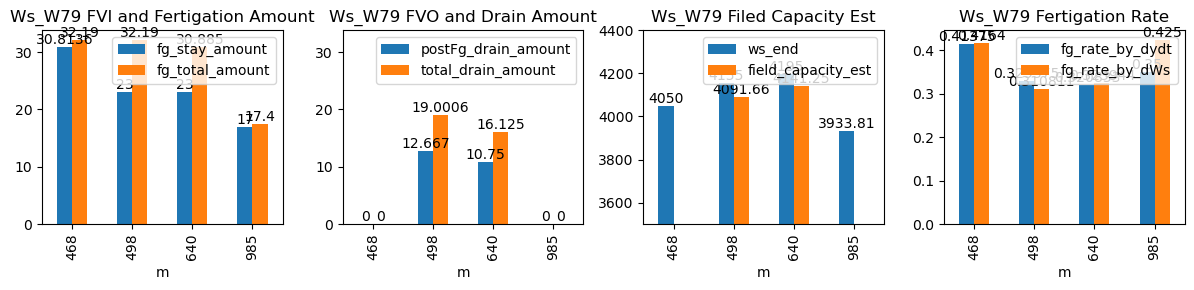
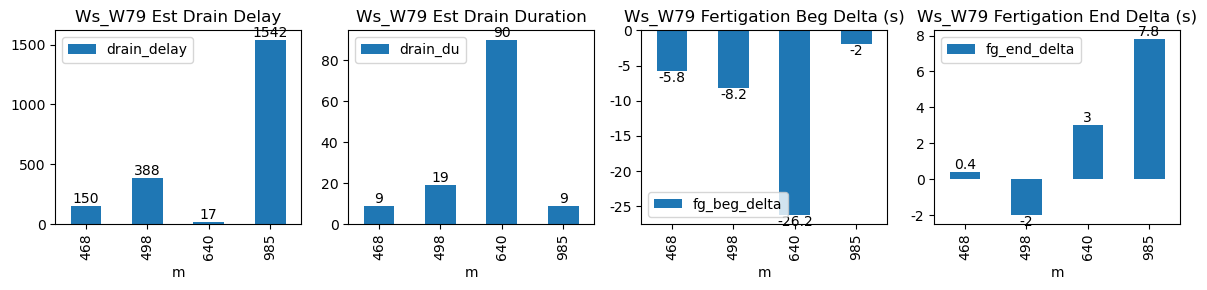
468 |
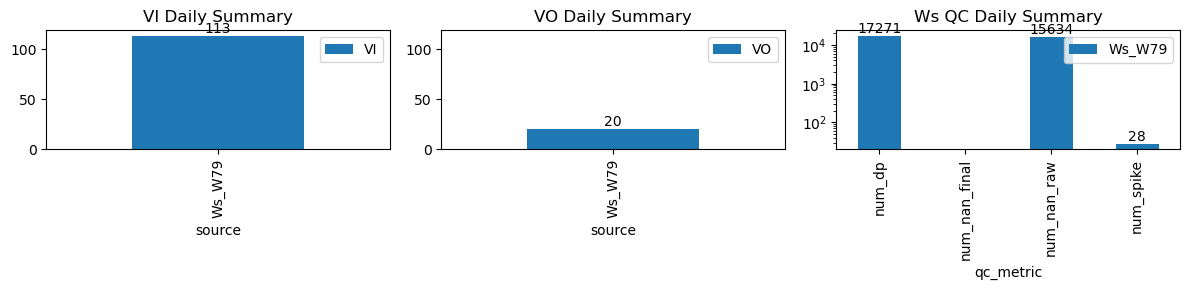
Ws_W79 |
8.581243 |
28.083333 |
468.68 |
468.583333 |
469.91 |
469.916667 |
3894.227273 |
4050.000000 |
74 |
-0.042373 |
-0.080556 |
0.000000 |
0.417083 |
0.421007 |
31.154545 |
True |
-5.8 |
0.4 |
32.190 |
0.0 |
0.0 |
0.0 |
9 |
150 |
-2.461385 |
NaN |
| 2026-03-02 08:18:43+08:00 |
147 |
498 |
Ws_W79 |
8.581243 |
30.000000 |
498.72 |
498.583333 |
499.95 |
499.916667 |
4040.000000 |
4160.000000 |
74 |
0.000000 |
-0.380556 |
0.000000 |
0.335000 |
0.324324 |
24.000000 |
True |
-8.2 |
-2.0 |
32.190 |
0.0 |
0.0 |
0.0 |
19 |
388 |
-4.270833 |
NaN |
| 2026-03-02 10:40:01+08:00 |
147 |
640 |
Ws_W79 |
8.581243 |
30.000000 |
640.02 |
639.583333 |
641.20 |
641.250000 |
4080.000000 |
4200.000000 |
71 |
0.000000 |
-0.213194 |
0.000000 |
0.320833 |
0.338028 |
24.000000 |
True |
-26.2 |
3.0 |
30.885 |
6.5 |
13.0 |
19.5 |
90 |
17 |
-4.916667 |
4135.0 |
| 2026-03-02 16:25:42+08:00 |
147 |
985 |
Ws_W79 |
8.581243 |
30.000000 |
985.70 |
985.666667 |
986.37 |
986.500000 |
3848.811189 |
3938.811189 |
40 |
0.000000 |
-0.004861 |
-0.002778 |
0.350000 |
0.450000 |
18.000000 |
True |
-2.0 |
7.8 |
18.000 |
0.0 |
0.0 |
0.0 |
9 |
1542 |
-2.247454 |
NaN |