VI and VO Daily Summary
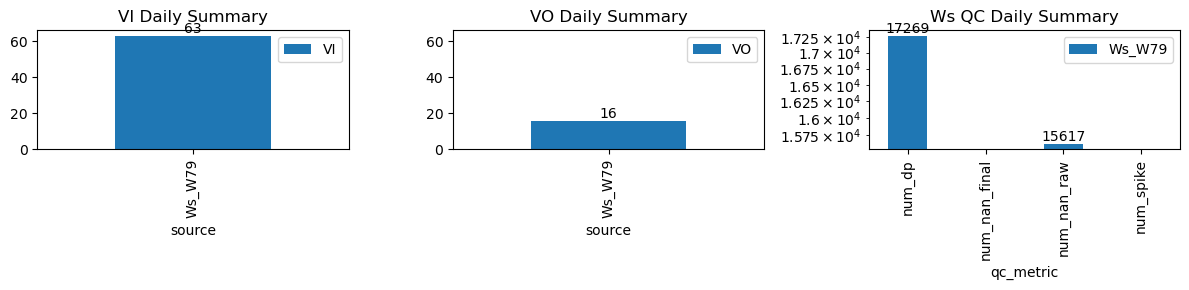
| ws_name | num_dp | num_nan_raw | num_nan_final | num_spike | cum_step_adj |
|---|---|---|---|---|---|
| Ws_W79 | 17,269 | 15,617 | 0 | 0 | 0.00 |
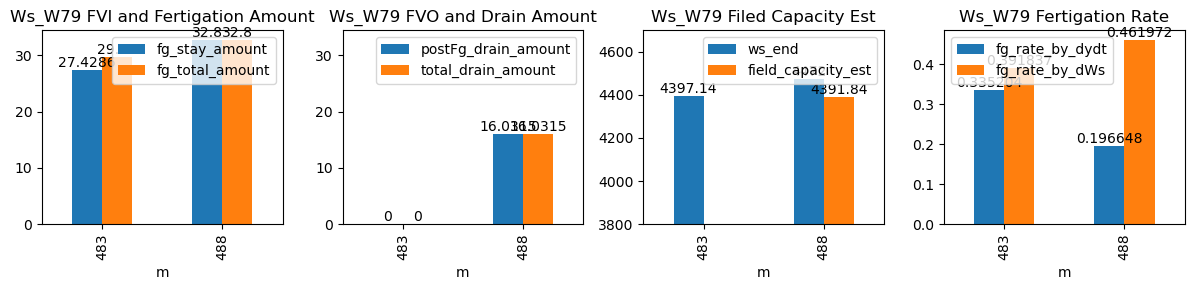
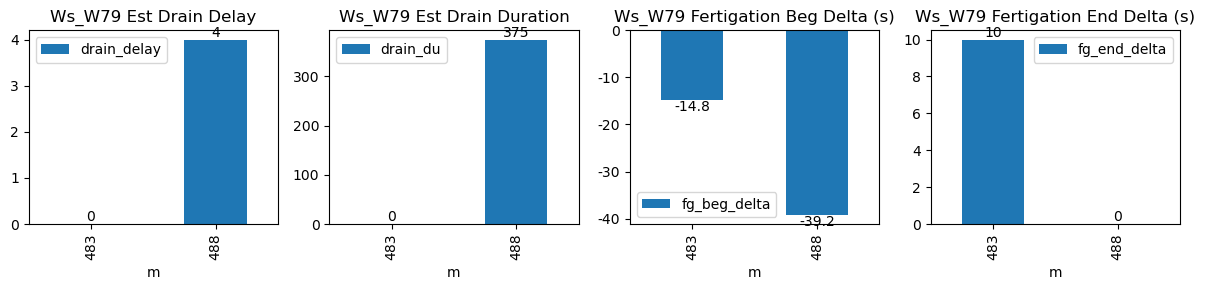
| ds | d | m | ws_name | prominence_cut | max_drain_du | fg_beg | fg_beg_est | fg_end | fg_end_est | ws_beg | ws_end | duc | pre_fg_et | post_fg_ws | post_drn_et | fg_rate_by_dydt | fg_rate_by_dWs | fg_stay_amount | enough_data | fg_beg_delta | fg_end_delta | fg_total_amount | fg_drain_amount | postFg_drain_amount | total_drain_amount | drain_du | drain_delay | drain_rate | field_capacity_est |
|---|---|---|---|---|---|---|---|---|---|---|---|---|---|---|---|---|---|---|---|---|---|---|---|---|---|---|---|---|---|
| 2026-03-03 08:03:35+08:00 | 148 | 483 | Ws_W79 | 2.123072 | 3.25 | 483.58 | 483.333333 | 484.75 | 484.750000 | 4260.0 | 4400.0 | 70 | 0.0 | 0.000000 | 0.0 | 0.341327 | 0.400000 | 28.0 | True | -14.8 | 0.0 | 29.75 | 0.0 | 0.0 | 0.0 | 90 | 15 | -1.428571 | NaN |
| 2026-03-03 08:08:19+08:00 | 148 | 488 | Ws_W79 | 2.123072 | 30.00 | 488.32 | 487.666667 | 489.50 | 489.583333 | 4308.0 | 4480.0 | 71 | 0.0 | -0.342824 | 0.0 | 0.195110 | 0.484507 | 34.4 | True | -39.2 | 5.0 | 34.40 | 0.0 | 15.6 | 15.6 | 85 | 15 | -6.125000 | 4402.0 |