| 2026-03-04 08:12:06+08:00 |
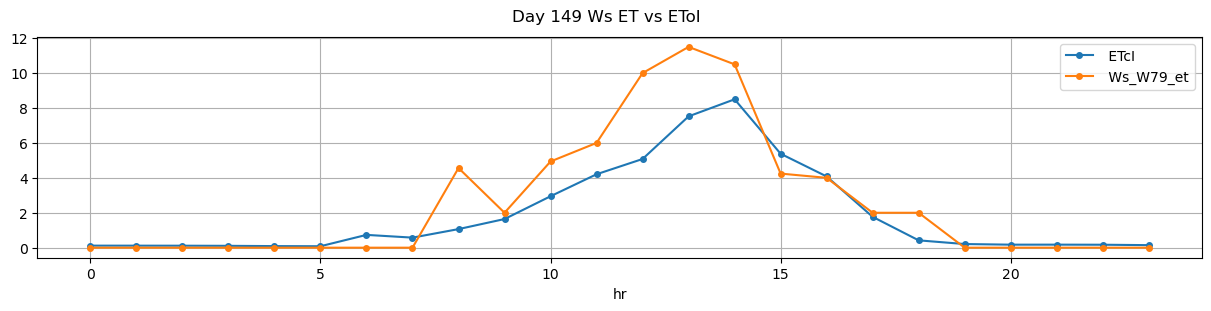
149 |
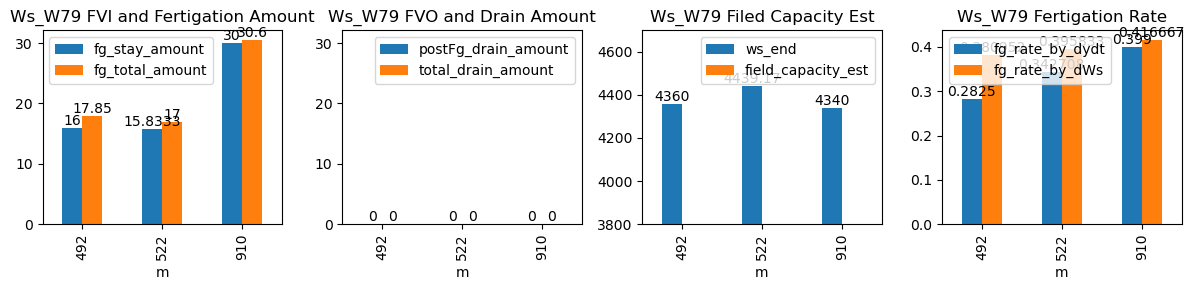
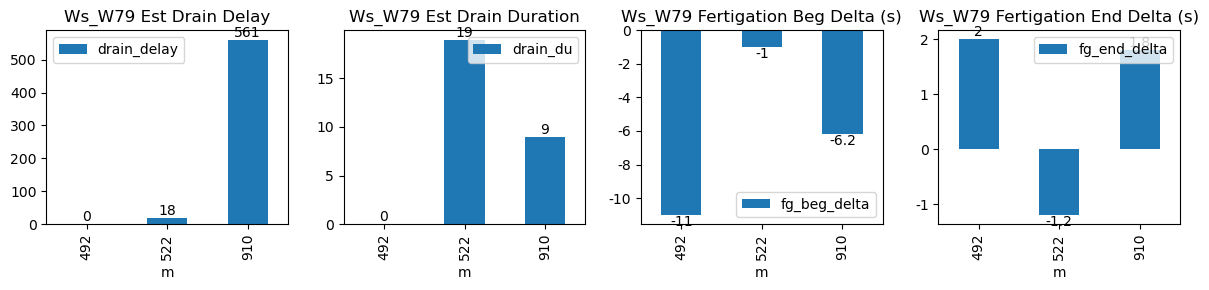
492 |
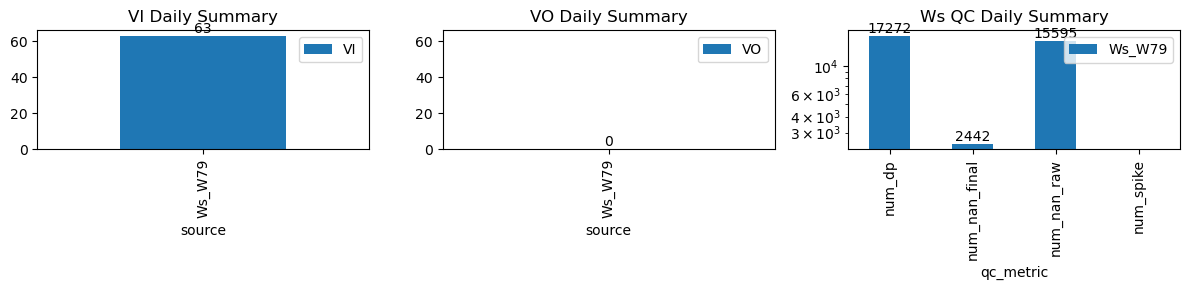
Ws_W79 |
1.617613 |
29.166667 |
492.10 |
491.916667 |
492.80 |
492.833333 |
4280.0 |
4360.0 |
42 |
-0.121469 |
0.000000 |
0.000000 |
0.290000 |
0.380952 |
16.0 |
True |
-11.0 |
2.0 |
16.737 |
0.0 |
0 |
0.0 |
NaN |
NaN |
NaN |
NaN |
| 2026-03-04 08:42:06+08:00 |
149 |
522 |
Ws_W79 |
1.617613 |
30.000000 |
522.10 |
522.083333 |
522.77 |
522.750000 |
4360.0 |
4440.0 |
40 |
0.000000 |
-0.086111 |
0.000000 |
0.343125 |
0.400000 |
16.0 |
True |
-1.0 |
-1.2 |
16.000 |
0.0 |
0 |
0.0 |
19.0 |
18.0 |
-2.500000 |
NaN |
| 2026-03-04 15:10:01+08:00 |
149 |
910 |
Ws_W79 |
1.617613 |
30.000000 |
910.02 |
909.916667 |
911.22 |
911.250000 |
4190.0 |
4340.0 |
72 |
-0.012994 |
-0.051389 |
-0.017659 |
0.408000 |
0.416667 |
30.0 |
True |
-6.2 |
1.8 |
30.000 |
0.0 |
0 |
0.0 |
9.0 |
561.0 |
-2.284993 |
NaN |