| 2026-03-05 08:10:43+08:00 |
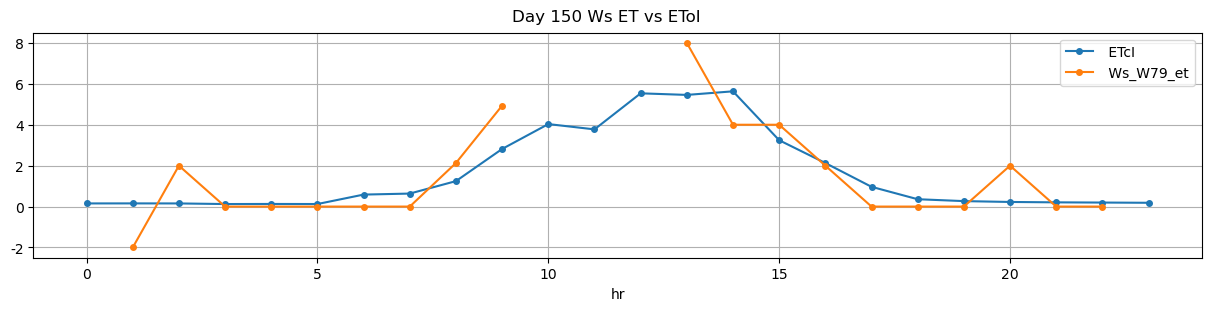
150 |
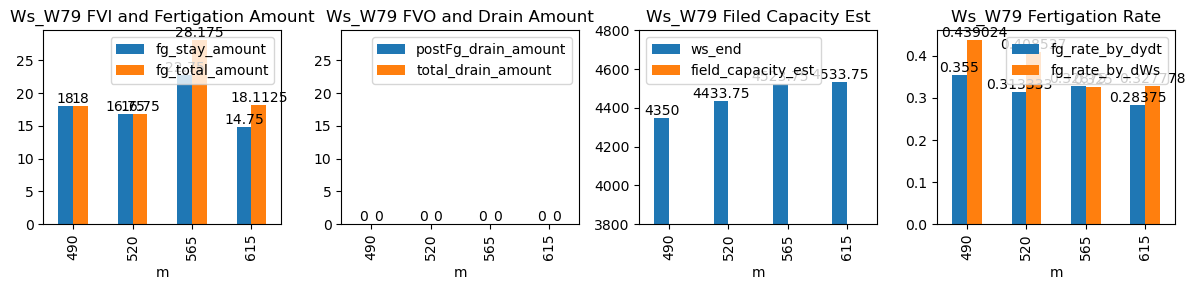
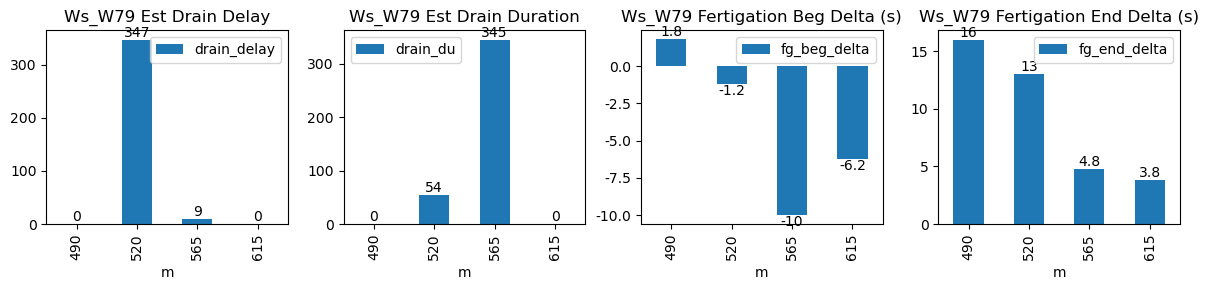
490 |
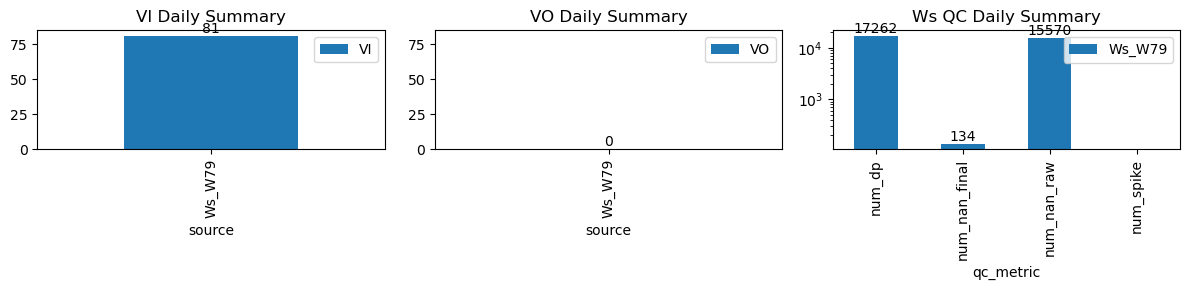
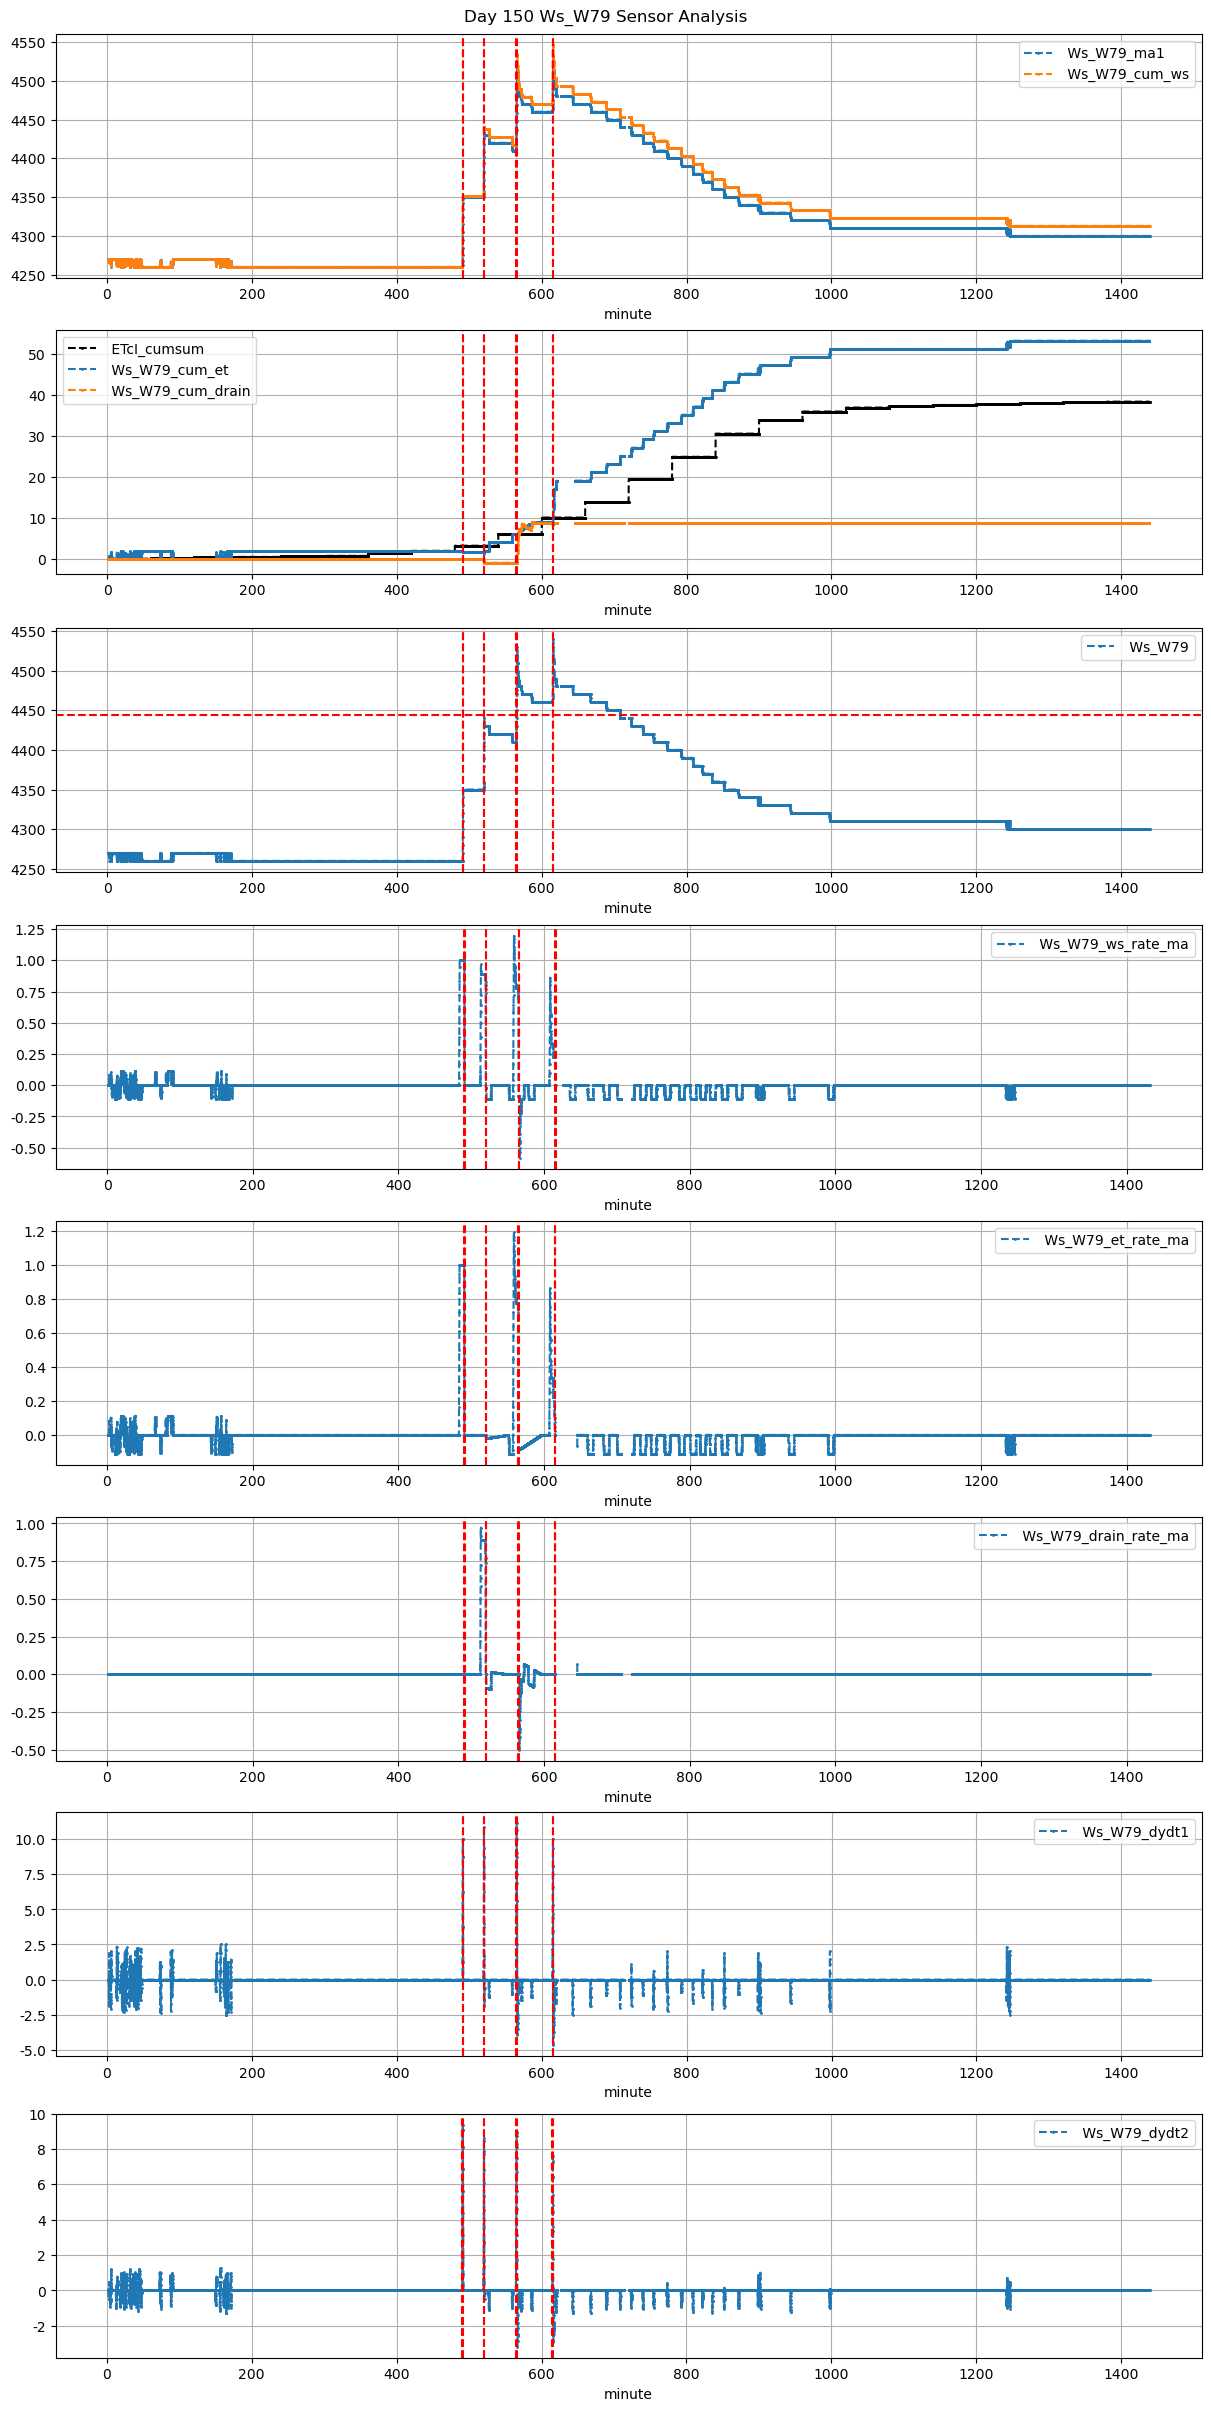
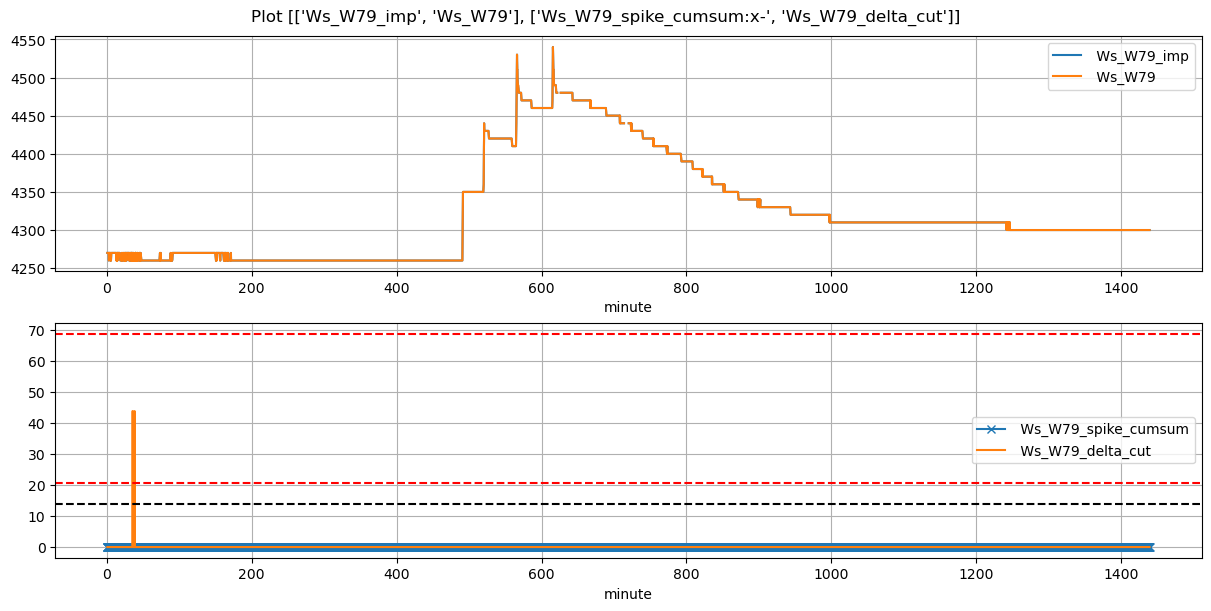
Ws_W79 |
2.193348 |
28.5 |
490.72 |
490.750000 |
491.40 |
491.500000 |
4260.0 |
4350.0 |
41 |
0.000000 |
0.000000 |
0.000000 |
0.362500 |
0.439024 |
18.0 |
True |
1.8 |
6.0 |
18.0000 |
0.0 |
0.000000 |
0.000000 |
NaN |
NaN |
NaN |
NaN |
| 2026-03-05 08:40:01+08:00 |
150 |
520 |
Ws_W79 |
2.193348 |
30.0 |
520.02 |
520.000000 |
520.70 |
520.750000 |
4350.0 |
4440.0 |
41 |
0.000000 |
-0.122222 |
0.000000 |
0.319167 |
0.439024 |
18.0 |
True |
-1.2 |
3.0 |
18.0000 |
0.0 |
0.000000 |
0.000000 |
9.0 |
17.0 |
-1.468750 |
NaN |
| 2026-03-05 09:25:00+08:00 |
150 |
565 |
Ws_W79 |
2.193348 |
30.0 |
565.00 |
564.833333 |
566.17 |
566.166667 |
4410.0 |
4530.0 |
70 |
-0.143503 |
-0.269444 |
0.000000 |
0.330000 |
0.342857 |
24.0 |
True |
-10.0 |
-0.2 |
27.8950 |
0.0 |
7.473249 |
7.473249 |
70.0 |
14.0 |
-2.984487 |
NaN |
| 2026-03-05 10:15:01+08:00 |
150 |
615 |
Ws_W79 |
2.193348 |
30.0 |
615.02 |
614.916667 |
615.77 |
615.750000 |
4460.0 |
4540.0 |
45 |
0.000000 |
-0.651515 |
-0.065278 |
0.290625 |
0.355556 |
16.0 |
True |
-6.2 |
-1.2 |
17.9325 |
0.0 |
0.000000 |
0.000000 |
24.0 |
13.0 |
-3.786458 |
NaN |