| 2026-03-06 08:11:24+08:00 |
151 |
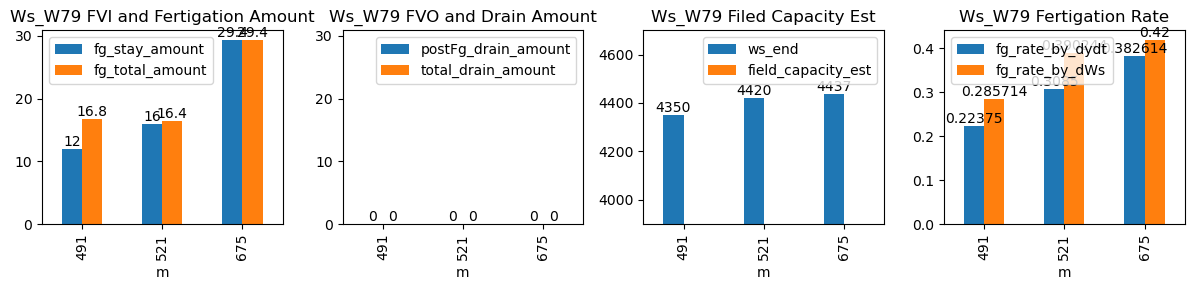
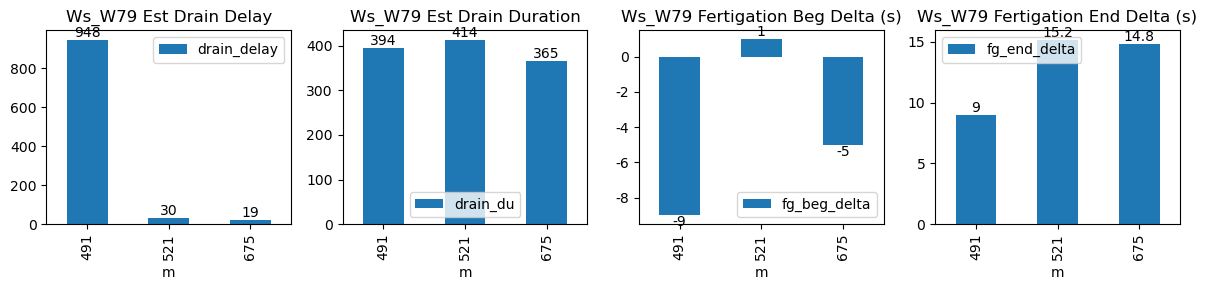
491 |
Ws_W79 |
1.605628 |
28.9 |
491.4 |
491.250000 |
492.10 |
492.083333 |
4290.0 |
4350.0 |
42 |
0.000000 |
0.000000 |
0.000000 |
0.231250 |
0.285714 |
12.0 |
True |
-9.0 |
-1.0 |
16.674 |
0.0 |
0 |
0.0 |
60 |
1338 |
-0.833333 |
NaN |
| 2026-03-06 08:41:54+08:00 |
151 |
521 |
Ws_W79 |
1.605628 |
30.0 |
521.9 |
521.916667 |
522.58 |
522.666667 |
4340.0 |
4420.0 |
41 |
-0.082778 |
-0.090278 |
-0.002778 |
0.315000 |
0.390244 |
16.0 |
True |
1.0 |
5.2 |
16.277 |
0.0 |
0 |
0.0 |
9 |
480 |
-0.961612 |
NaN |
| 2026-03-06 11:15:00+08:00 |
151 |
675 |
Ws_W79 |
1.605628 |
30.0 |
675.0 |
674.916667 |
676.17 |
676.250000 |
4290.0 |
4440.0 |
70 |
-0.091294 |
-0.137500 |
-0.133333 |
0.383977 |
0.428571 |
30.0 |
True |
-5.0 |
4.8 |
30.000 |
0.0 |
0 |
0.0 |
24 |
364 |
-1.983538 |
NaN |