| 2026-03-15 09:30:44+08:00 |
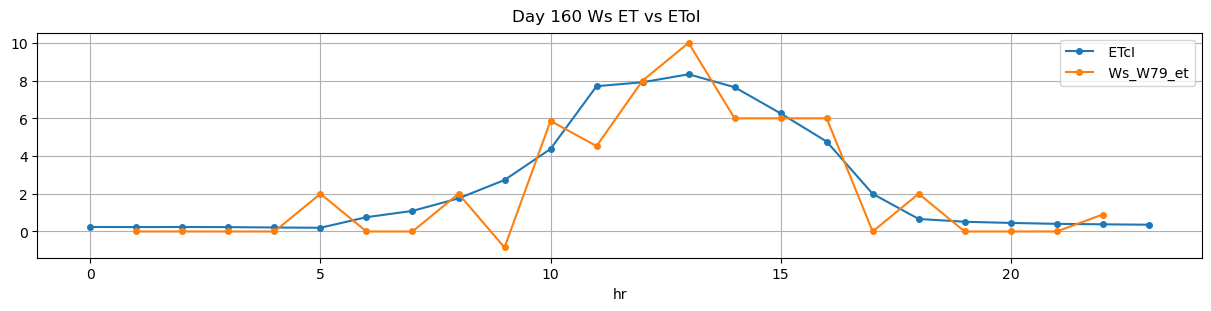
160 |
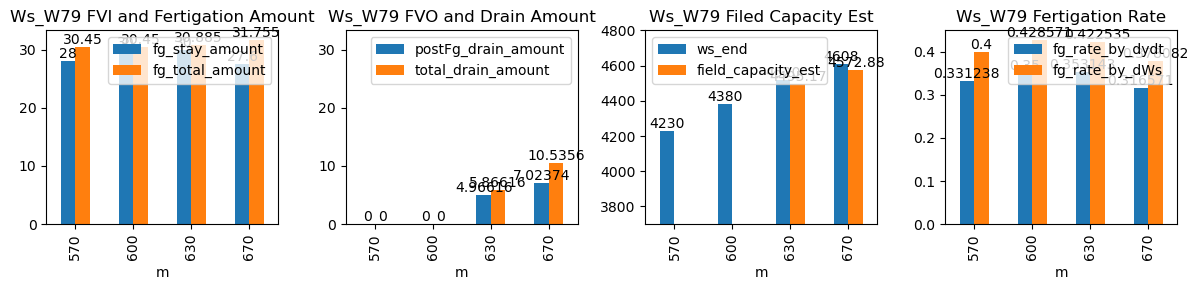
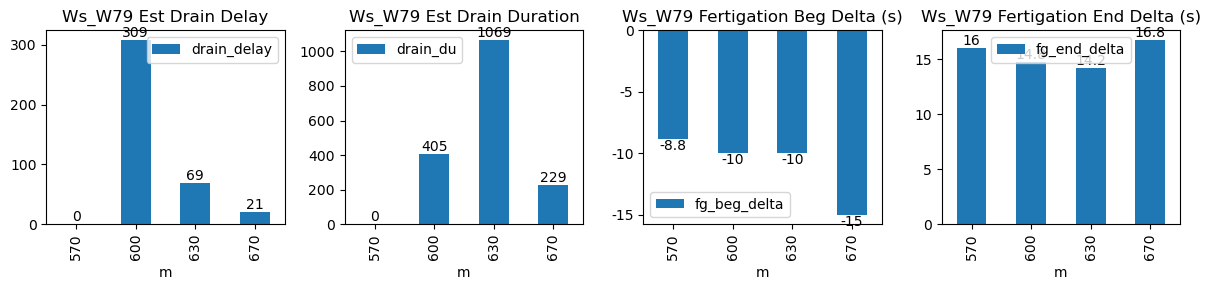
570 |
Ws_W79 |
1.342394 |
28.00 |
570.73 |
570.583333 |
571.90 |
572.000000 |
4090.0 |
4230.0 |
70 |
0.000000 |
0.000000 |
0.000000 |
0.336571 |
0.400000 |
28.0 |
True |
-8.8 |
6.0 |
30.450 |
0.0 |
0 |
0.0 |
NaN |
NaN |
NaN |
NaN |
| 2026-03-15 10:00:00+08:00 |
160 |
600 |
Ws_W79 |
1.342394 |
28.75 |
600.00 |
599.833333 |
601.17 |
601.250000 |
4230.0 |
4380.0 |
70 |
0.000000 |
0.000000 |
0.000000 |
0.355952 |
0.428571 |
30.0 |
True |
-10.0 |
4.8 |
30.450 |
0.0 |
0 |
0.0 |
24.0 |
699.0 |
-1.562500 |
NaN |
| 2026-03-15 10:30:00+08:00 |
160 |
630 |
Ws_W79 |
1.342394 |
30.00 |
630.00 |
629.833333 |
631.18 |
631.250000 |
4370.0 |
4520.0 |
71 |
0.000000 |
-0.202778 |
-0.122222 |
0.362286 |
0.422535 |
30.0 |
True |
-10.0 |
4.2 |
30.885 |
0.0 |
0 |
0.0 |
24.0 |
219.0 |
-1.882885 |
NaN |
| 2026-03-15 11:10:00+08:00 |
160 |
670 |
Ws_W79 |
1.342394 |
30.00 |
670.00 |
669.750000 |
671.22 |
671.333333 |
4470.0 |
4610.0 |
73 |
-0.000706 |
-0.222083 |
0.000000 |
0.318857 |
0.383562 |
28.0 |
True |
-15.0 |
6.8 |
31.755 |
0.0 |
0 |
0.0 |
50.0 |
31.0 |
-3.661808 |
NaN |