| 2026-03-19 08:20:44+08:00 |
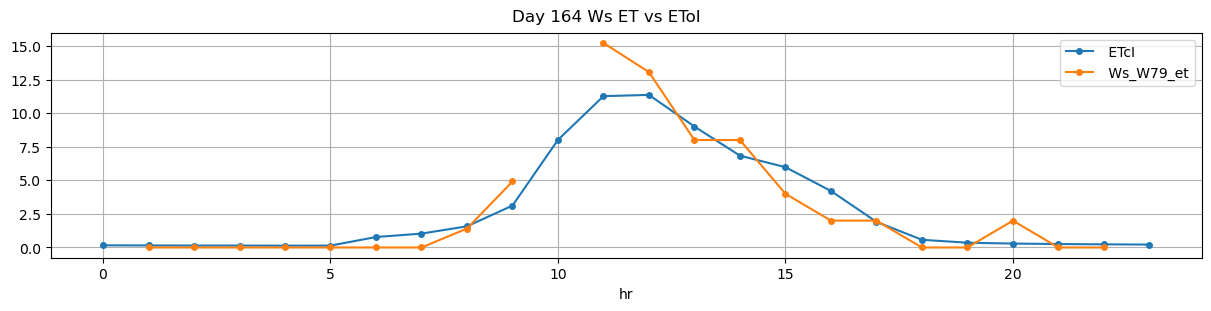
164 |
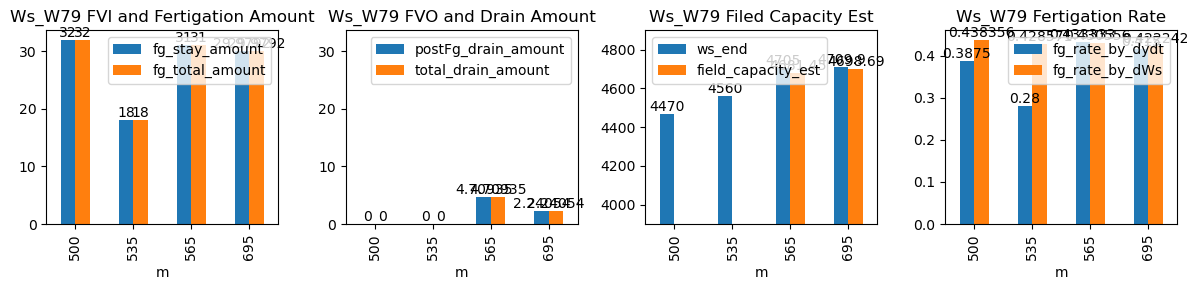
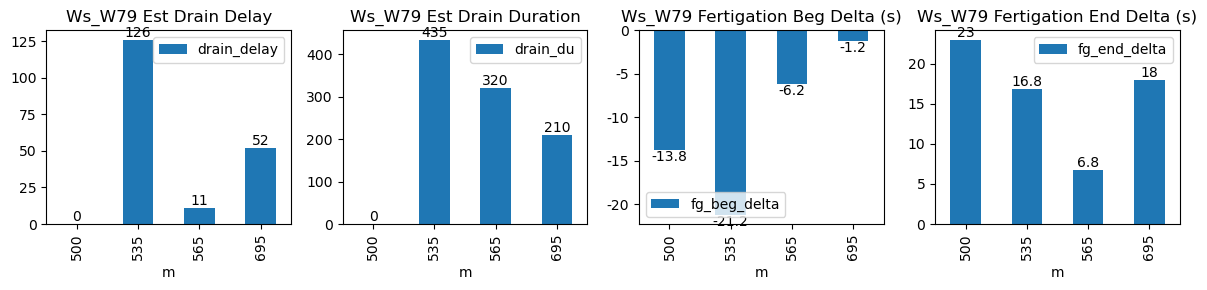
500 |
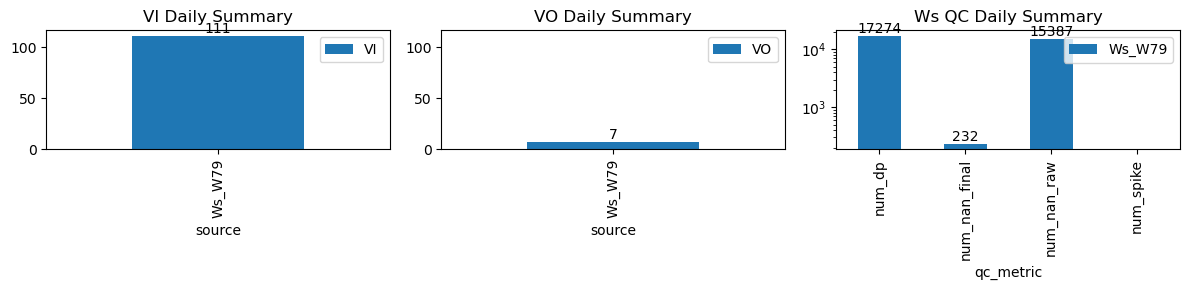
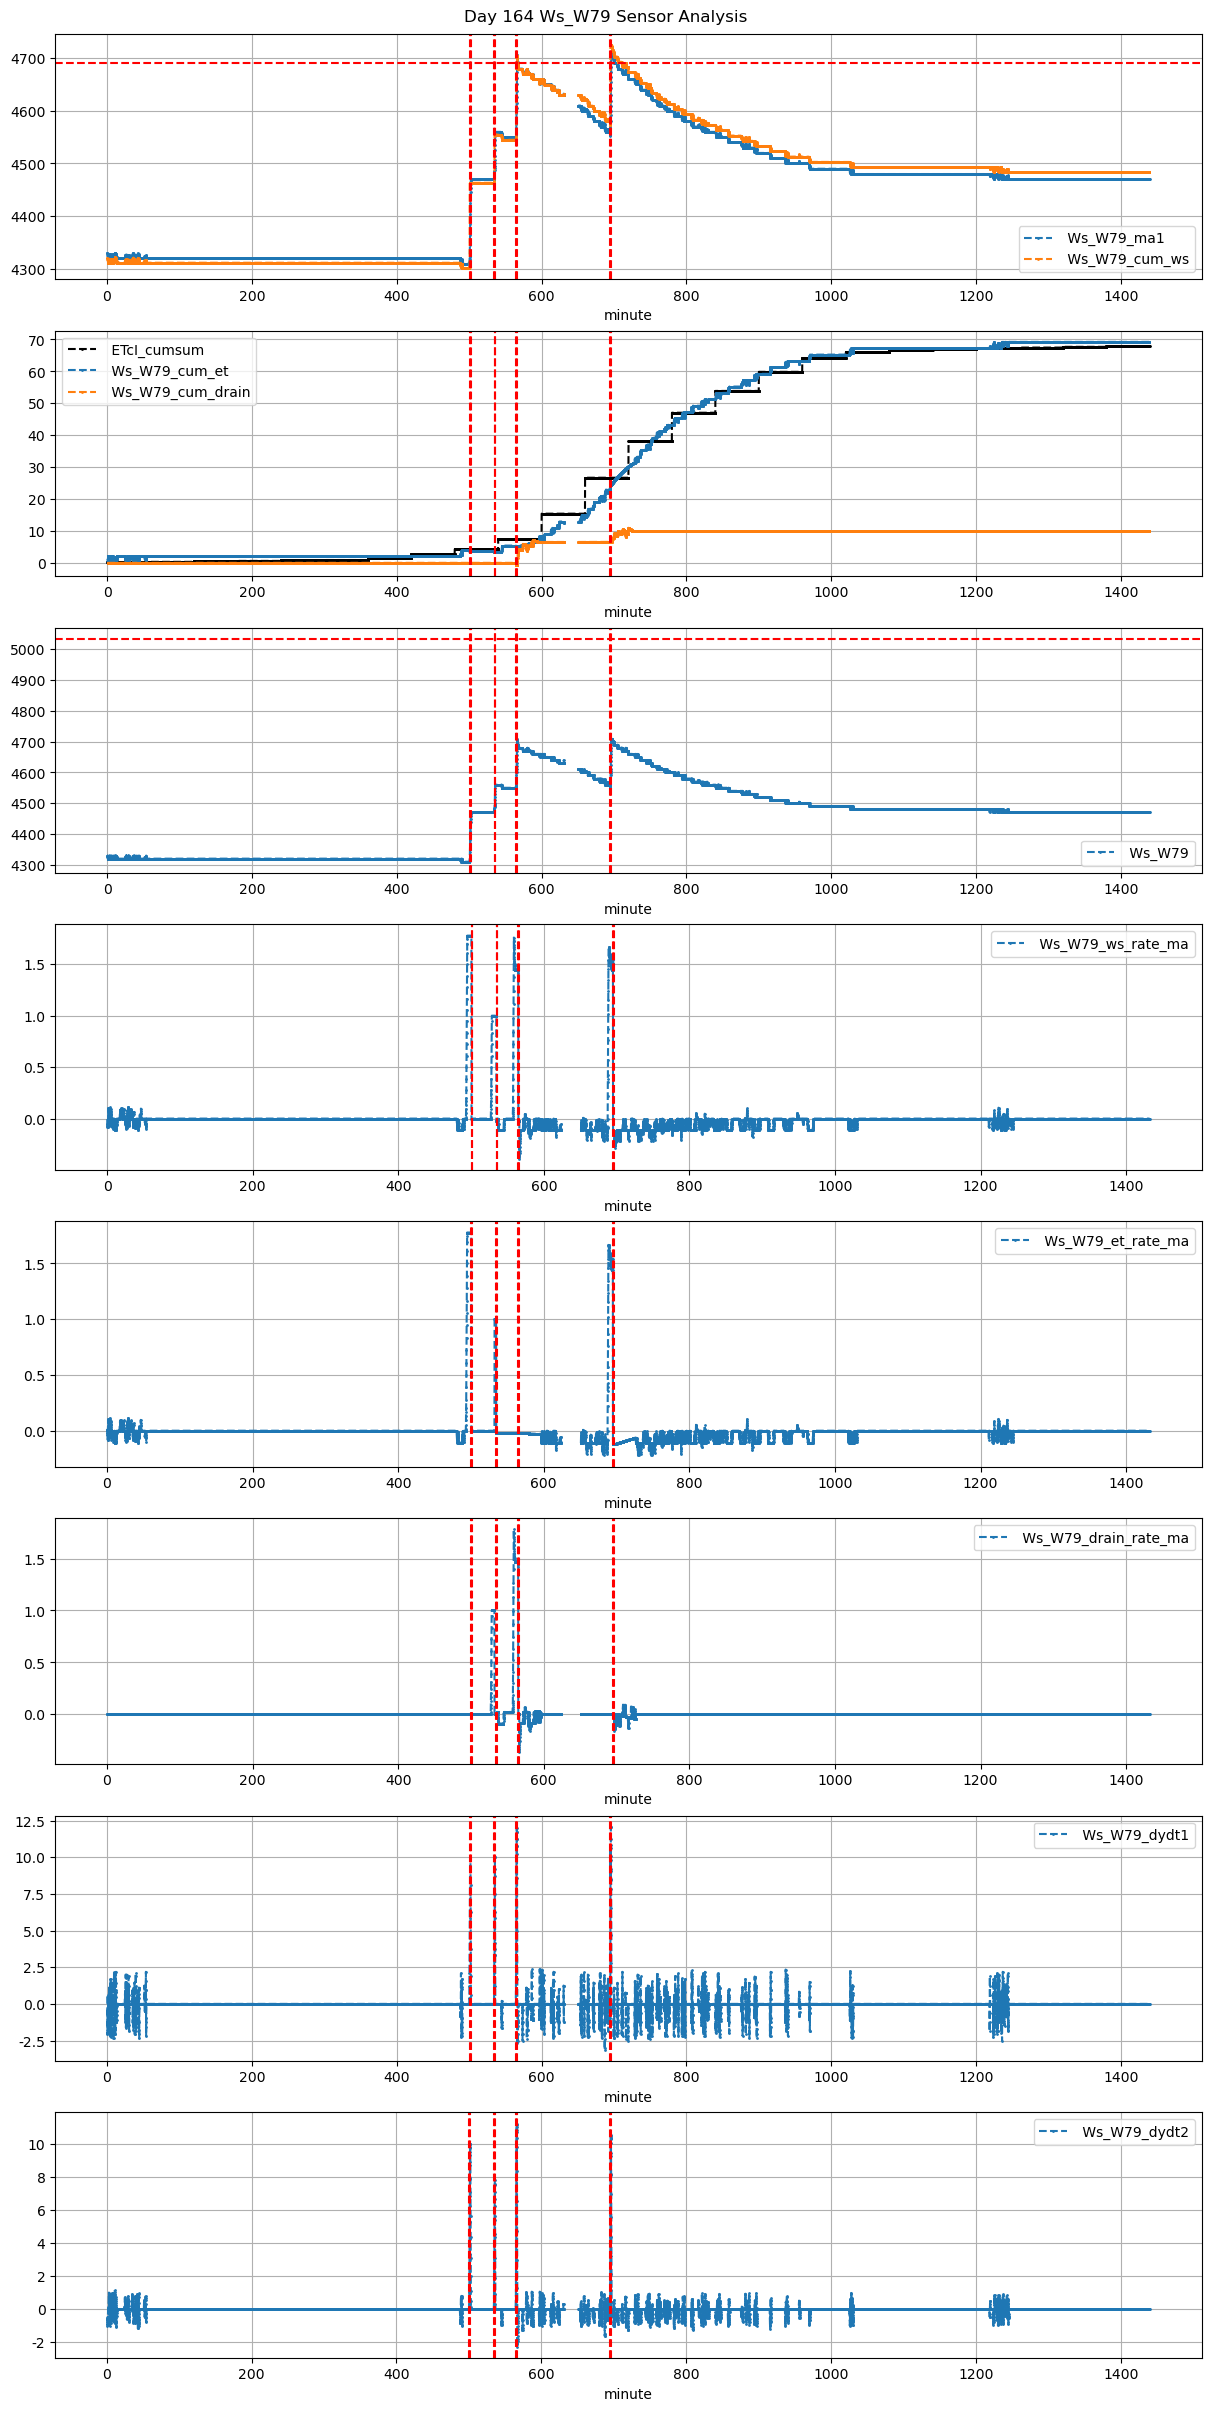
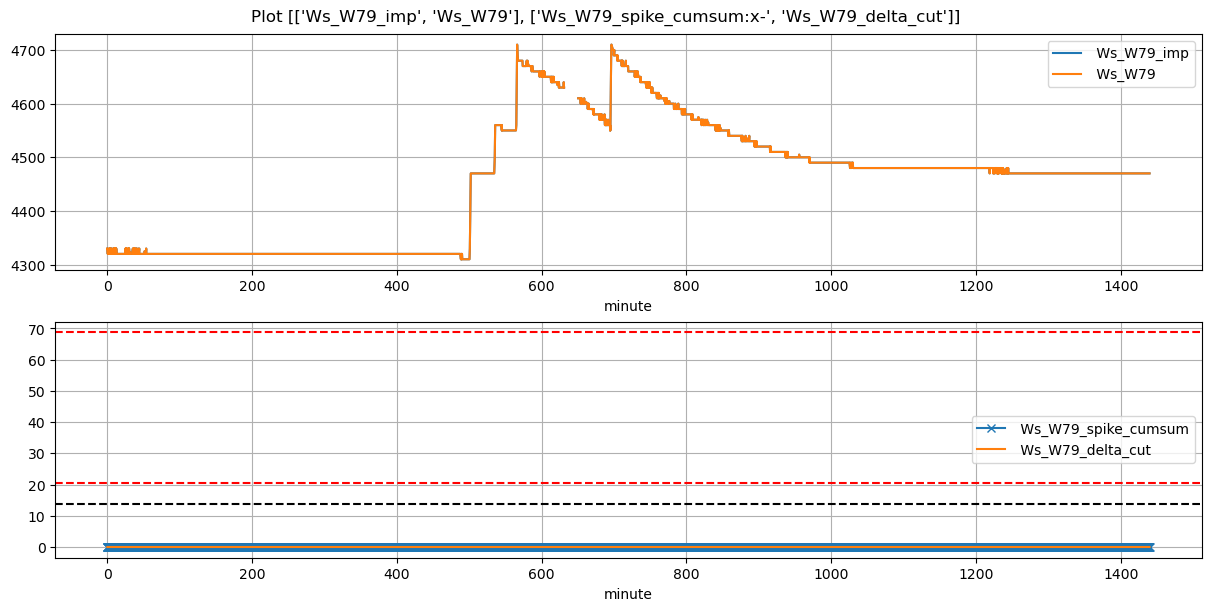
Ws_W79 |
1.495039 |
30.000000 |
500.73 |
500.500000 |
501.95 |
502.166667 |
4310.0 |
4470.0 |
73 |
0.000000 |
0.000000 |
0.000000 |
0.391667 |
0.438356 |
32.0 |
True |
-13.8 |
13.0 |
32.0 |
0.0 |
0.000000 |
0.000000 |
NaN |
NaN |
NaN |
NaN |
| 2026-03-19 08:55:01+08:00 |
164 |
535 |
Ws_W79 |
1.495039 |
29.166667 |
535.02 |
534.666667 |
535.72 |
535.833333 |
4470.0 |
4560.0 |
42 |
0.000000 |
-0.026389 |
0.000000 |
0.286667 |
0.428571 |
18.0 |
True |
-21.2 |
6.8 |
18.0 |
0.0 |
0.000000 |
0.000000 |
15.0 |
546.0 |
-1.666667 |
NaN |
| 2026-03-19 09:25:01+08:00 |
164 |
565 |
Ws_W79 |
1.495039 |
30.000000 |
565.02 |
564.916667 |
566.22 |
566.250000 |
4550.0 |
4710.0 |
72 |
0.000000 |
-0.138889 |
-0.036806 |
0.434167 |
0.444444 |
32.0 |
True |
-6.2 |
1.8 |
32.0 |
0.0 |
7.341667 |
7.341667 |
75.0 |
16.0 |
-2.499523 |
NaN |
| 2026-03-19 11:35:01+08:00 |
164 |
695 |
Ws_W79 |
1.495039 |
30.000000 |
695.02 |
695.000000 |
696.20 |
696.333333 |
4560.0 |
4710.0 |
71 |
-0.108757 |
-0.212153 |
-0.045139 |
0.415417 |
0.422535 |
30.0 |
True |
-1.2 |
8.0 |
30.0 |
0.0 |
0.000000 |
0.000000 |
15.0 |
202.0 |
-2.208146 |
NaN |