| 2026-03-20 08:40:00+08:00 |
165 |
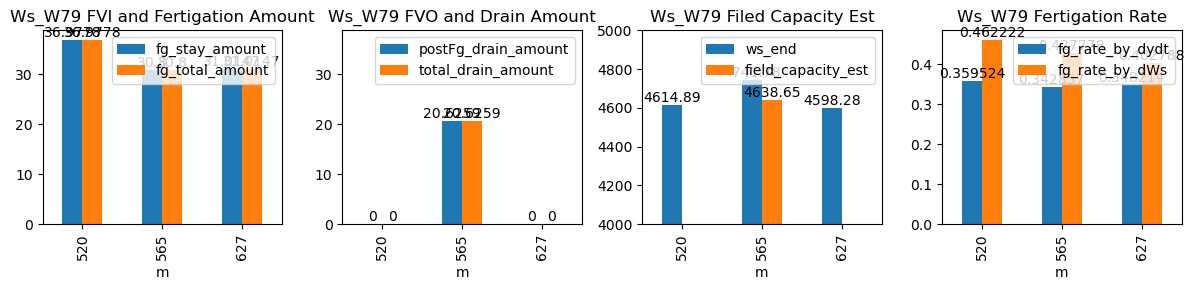
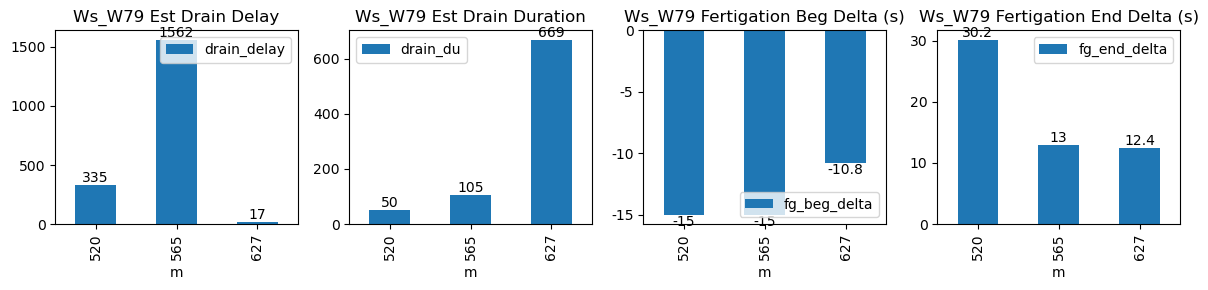
520 |
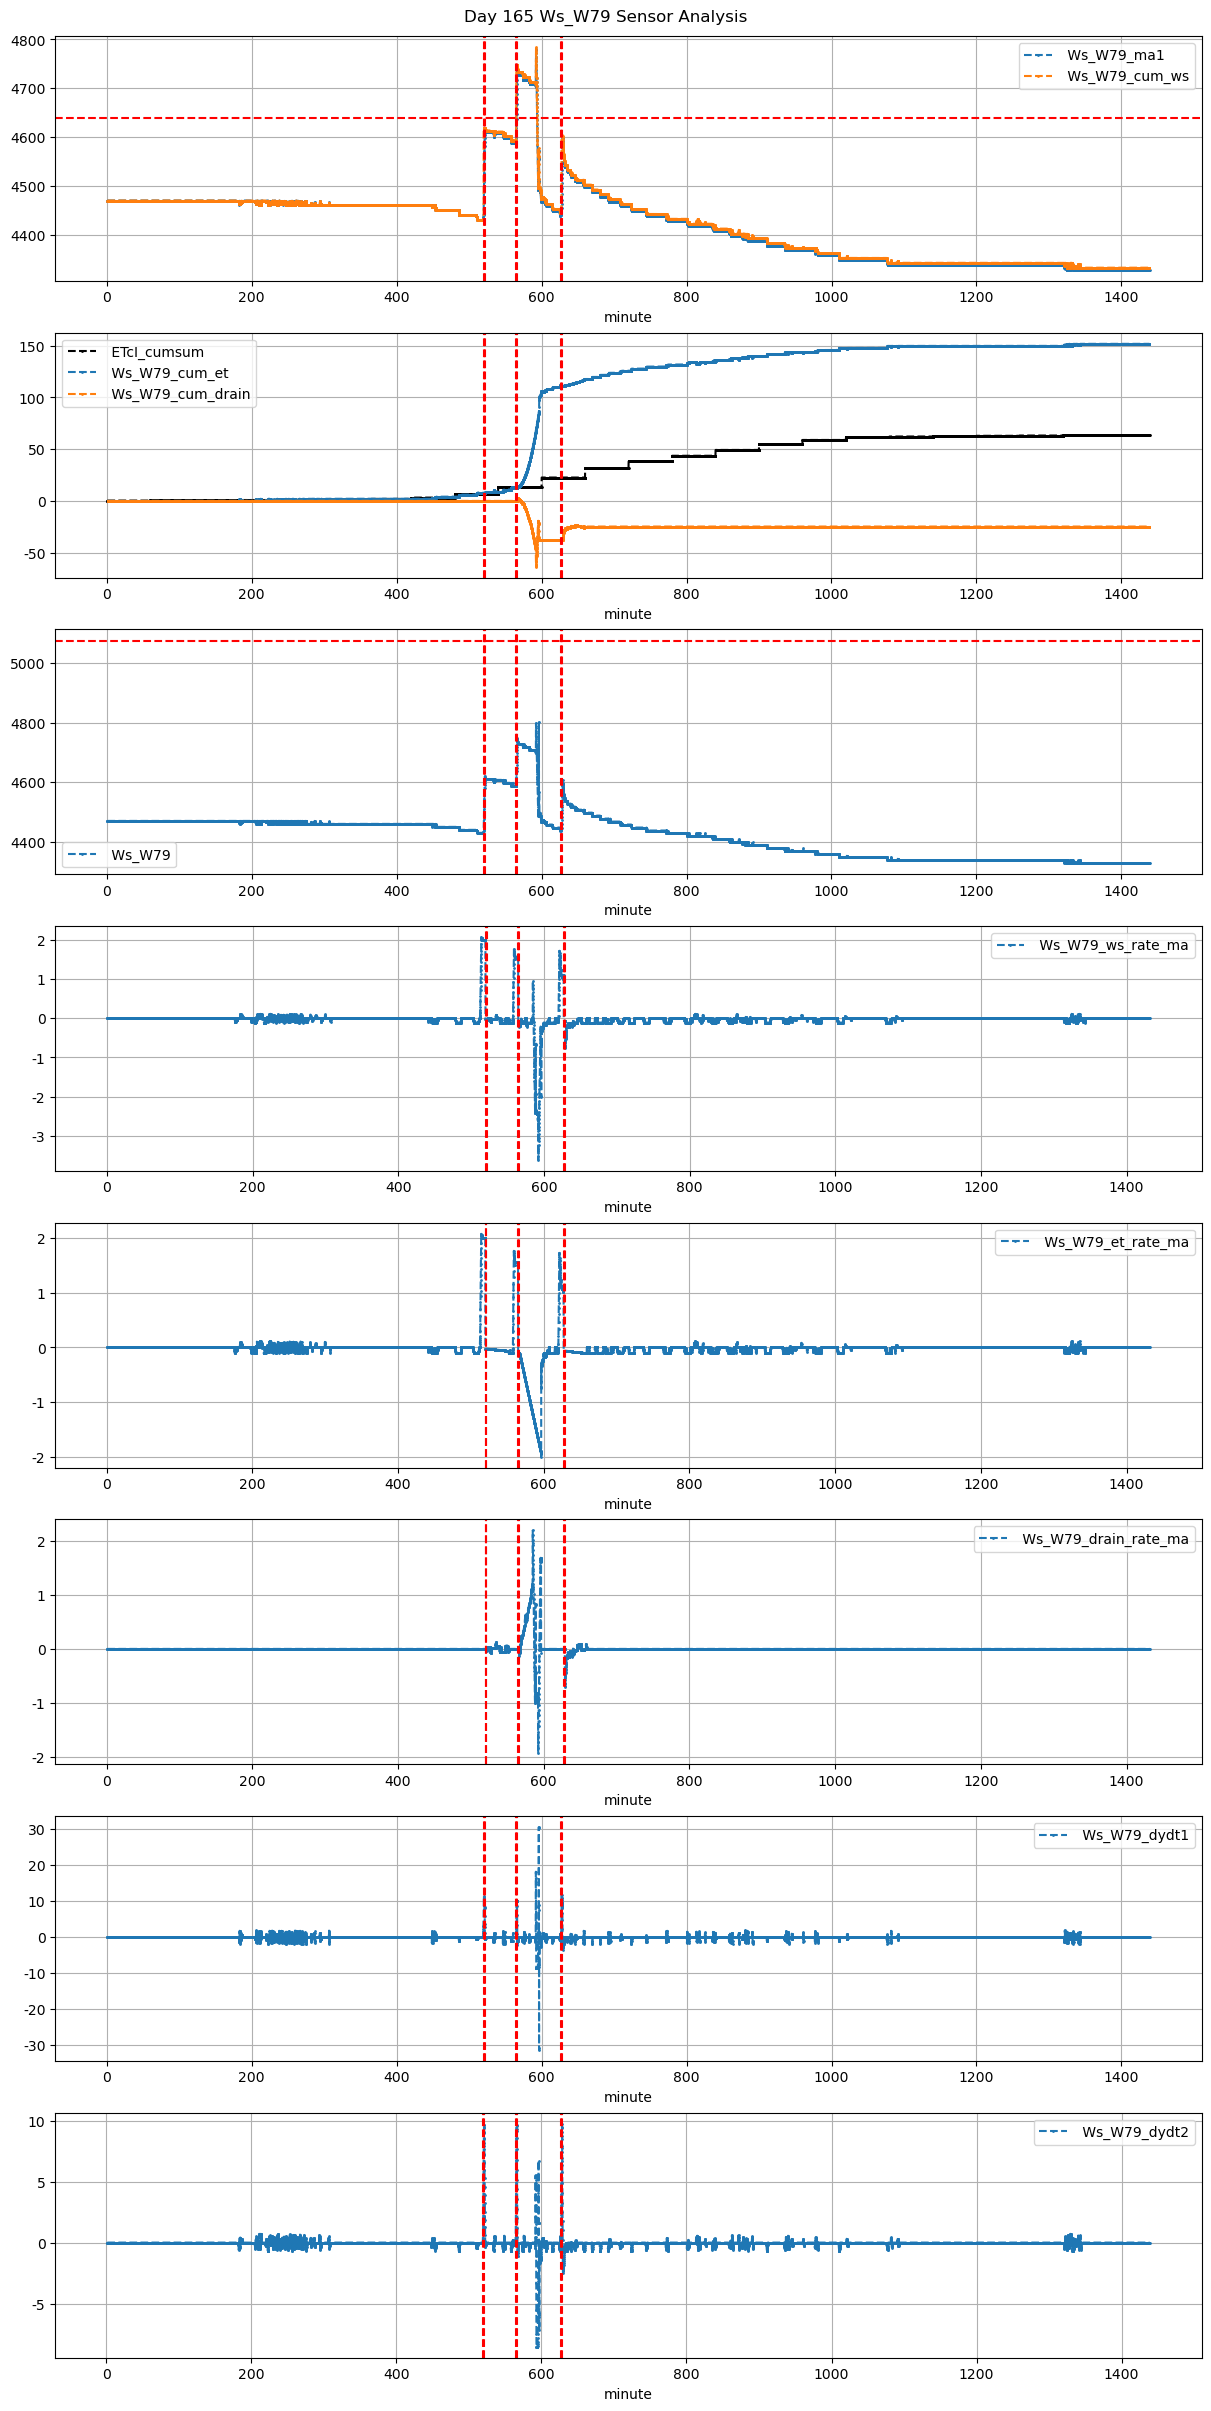
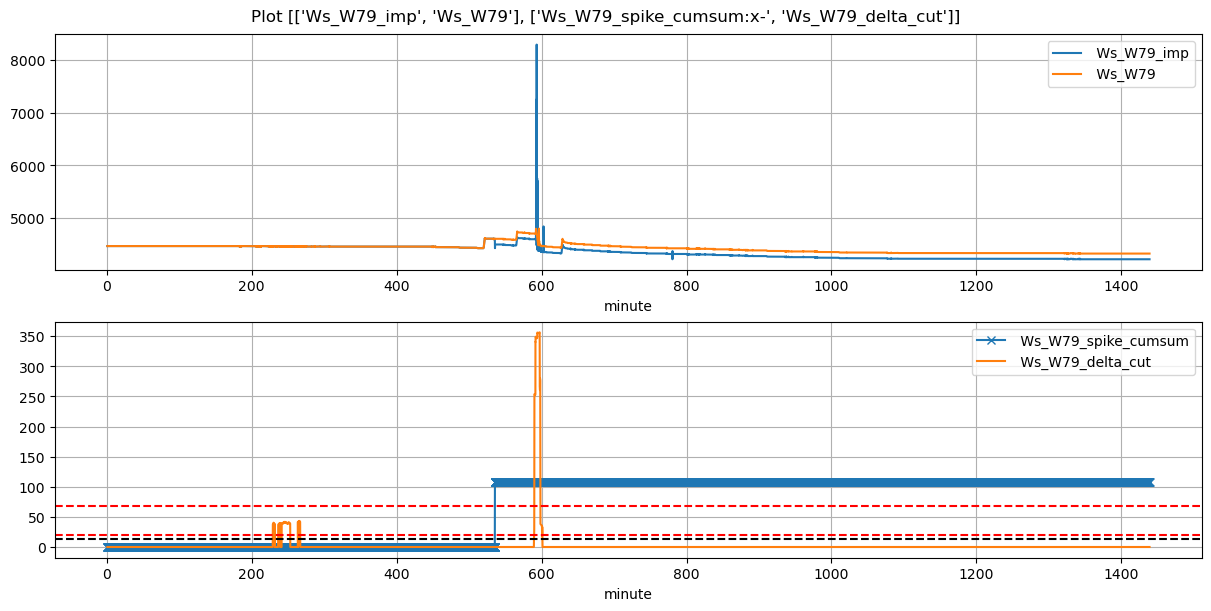
Ws_W79 |
1.244658 |
30 |
520.00 |
519.75 |
521.33 |
521.666667 |
4430.000000 |
4620.000000 |
80 |
-0.028013 |
-0.011458 |
-0.026389 |
0.361429 |
0.475000 |
38.00000 |
True |
-15.0 |
20.2 |
38.00000 |
0.0 |
0.000000 |
0.000000 |
20 |
1520 |
-1.769559 |
NaN |
| 2026-03-20 09:25:00+08:00 |
165 |
565 |
Ws_W79 |
1.244658 |
30 |
565.00 |
564.75 |
566.20 |
566.333333 |
4587.777778 |
4747.777778 |
72 |
-0.105650 |
-0.097917 |
-0.055060 |
0.347429 |
0.444444 |
32.00000 |
True |
-15.0 |
8.0 |
32.00000 |
0.0 |
2.232976 |
2.232976 |
60 |
22 |
-1.438470 |
NaN |
| 2026-03-20 10:27:26+08:00 |
165 |
627 |
Ws_W79 |
1.244658 |
30 |
627.43 |
627.25 |
628.71 |
628.833333 |
4670.737374 |
4837.222222 |
77 |
-0.046207 |
-0.412269 |
-0.153472 |
0.351224 |
0.432428 |
33.29697 |
True |
-10.8 |
7.4 |
33.29697 |
0.0 |
11.301498 |
11.301498 |
125 |
17 |
-2.449775 |
4780.714735 |