| 2026-03-22 08:06:21+08:00 |
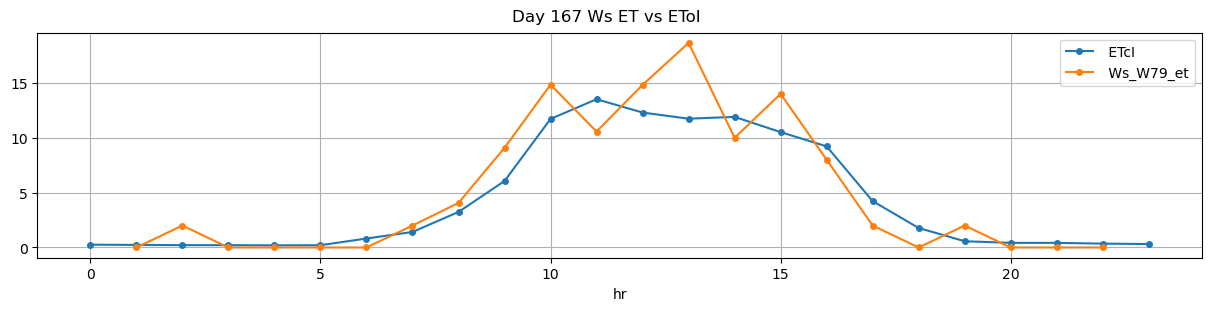
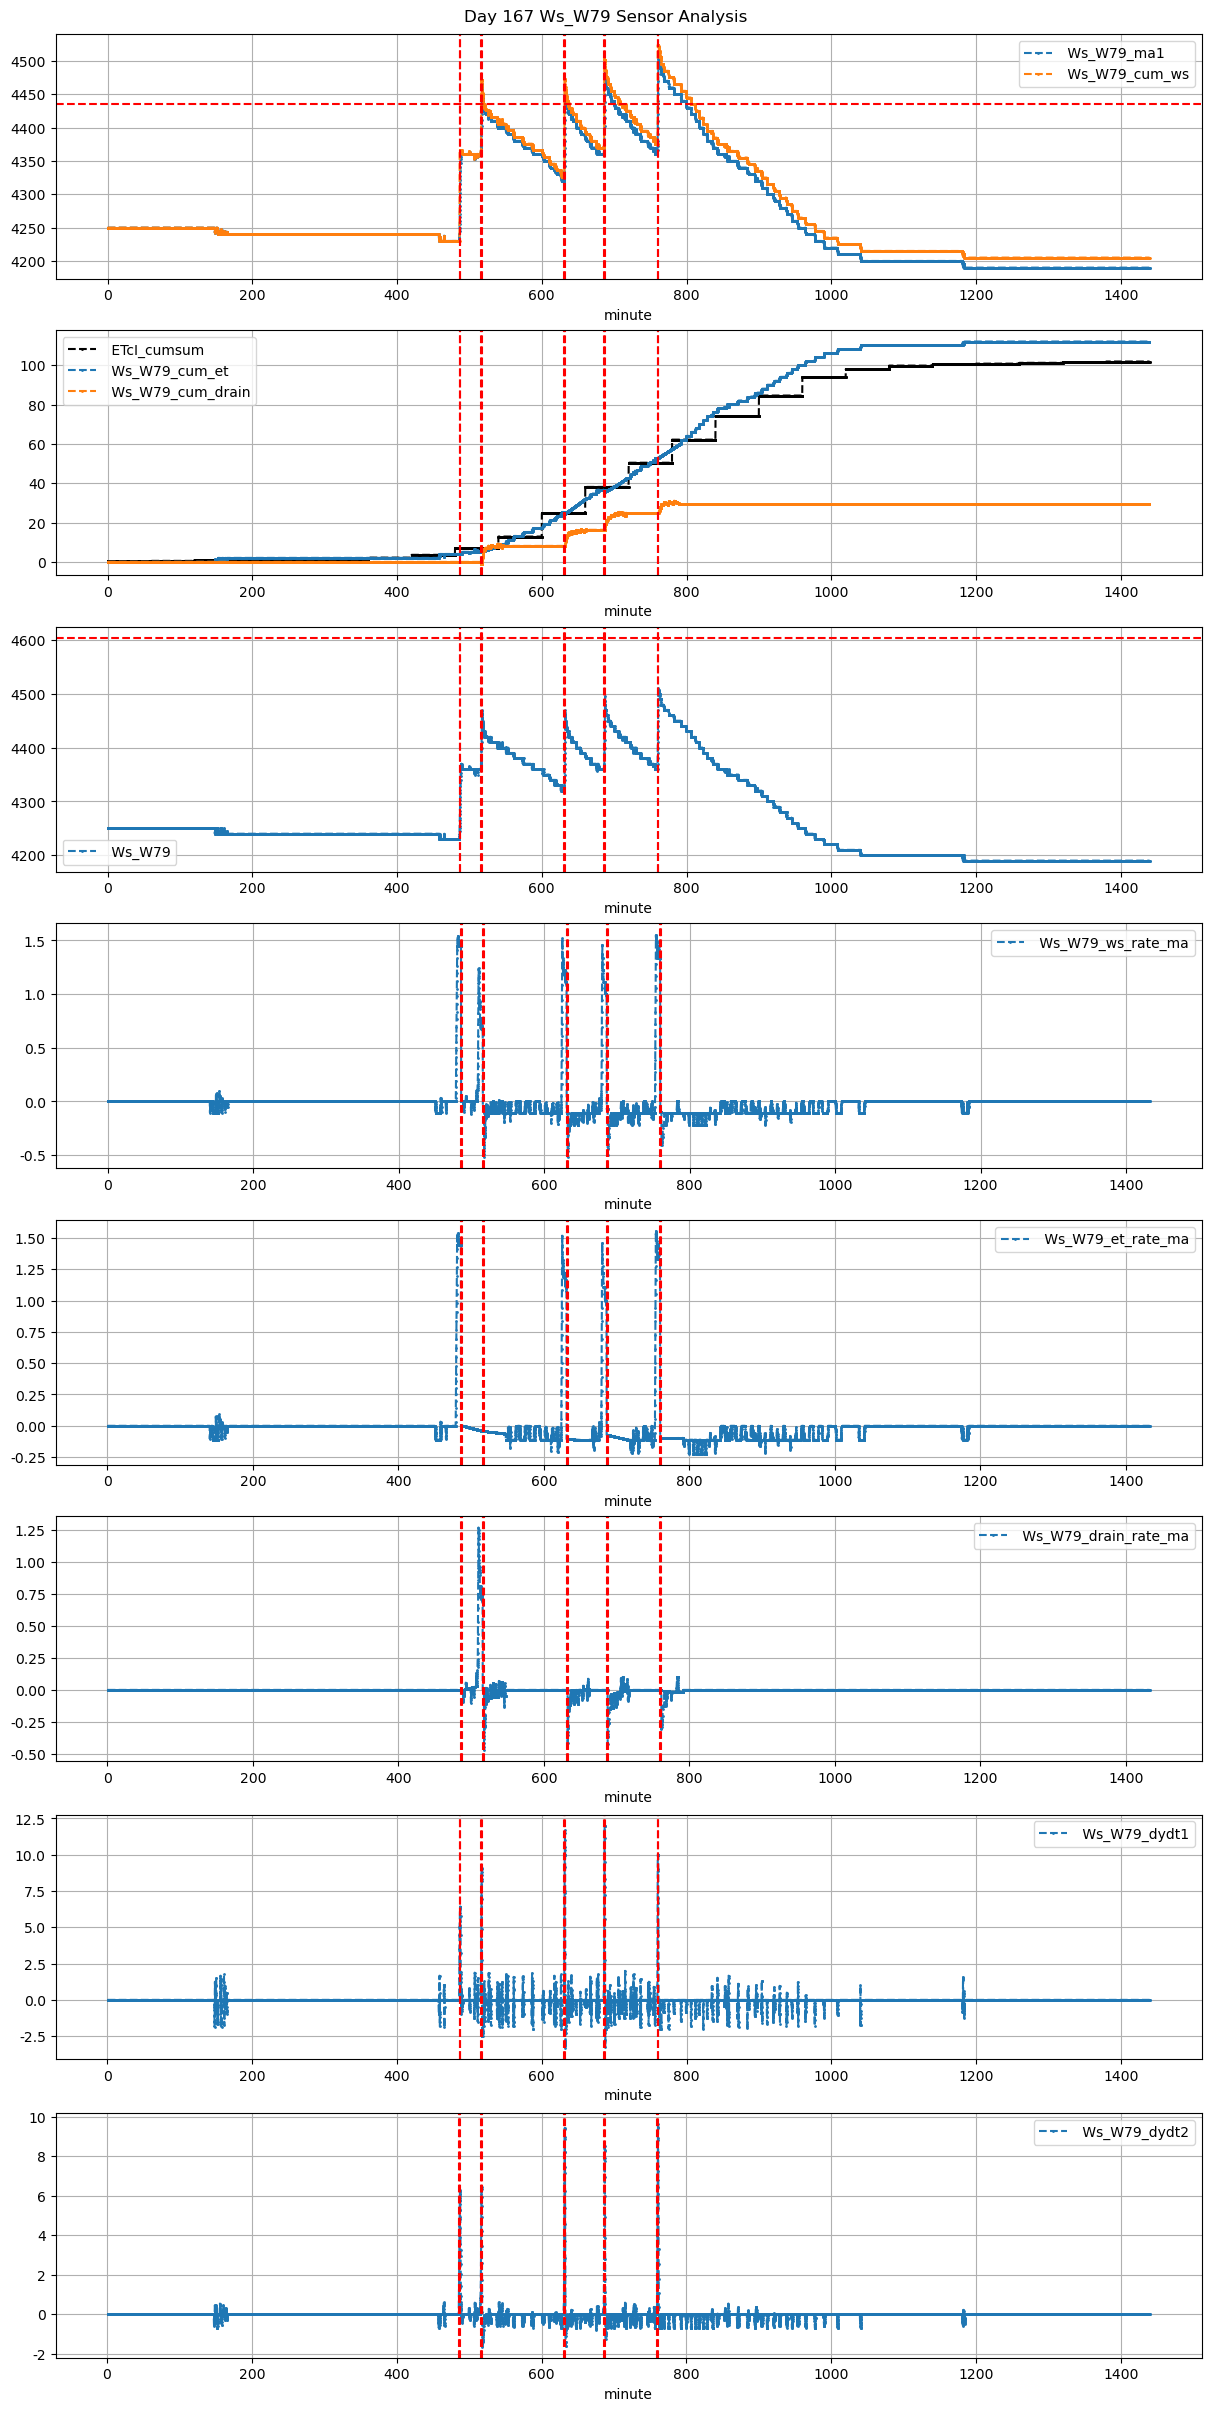
167 |
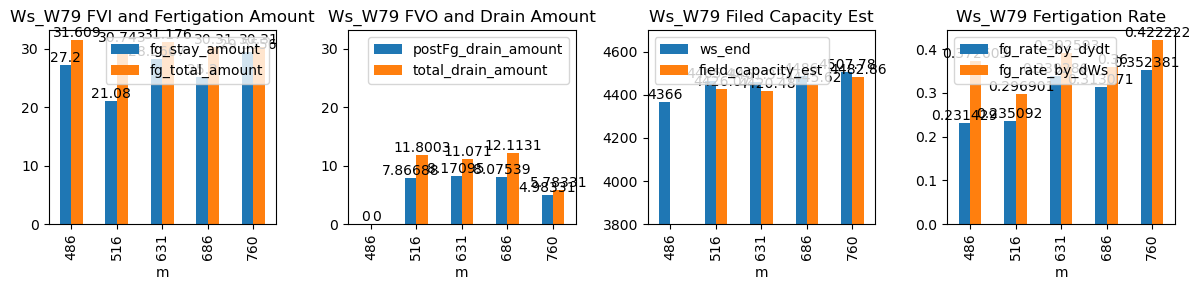
486 |
Ws_W79 |
1.173076 |
27.25 |
486.35 |
485.916667 |
487.57 |
488.750000 |
4230.0 |
4366.000000 |
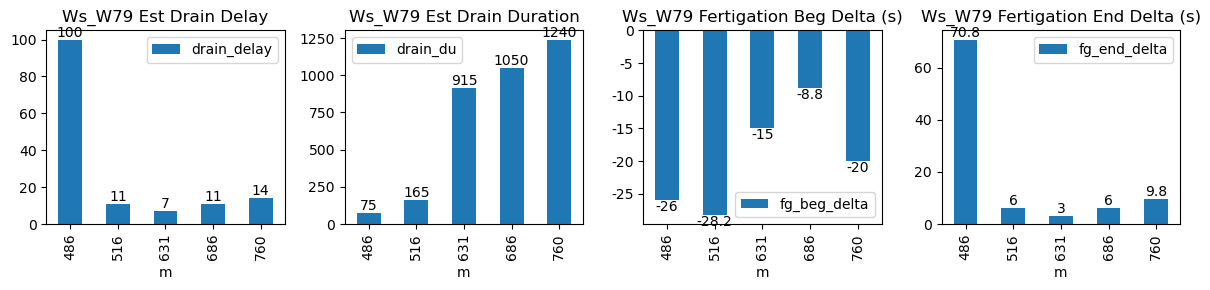
73 |
0.000000 |
-0.006276 |
0.000000 |
0.231429 |
0.372603 |
27.200000 |
True |
-26.0 |
70.8 |
31.609 |
0.000000 |
0.000000 |
0.000000 |
75 |
100 |
-0.081543 |
NaN |
| 2026-03-22 08:36:13+08:00 |
167 |
516 |
Ws_W79 |
1.173076 |
30.00 |
516.22 |
515.750000 |
517.40 |
517.500000 |
4360.0 |
4465.400000 |
71 |
-0.042089 |
-0.161934 |
-0.062963 |
0.235092 |
0.296901 |
21.080000 |
True |
-28.2 |
6.0 |
30.743 |
3.933439 |
7.866878 |
11.800317 |
165 |
11 |
-0.247803 |
4426.065611 |
| 2026-03-22 10:31:15+08:00 |
167 |
631 |
Ws_W79 |
1.173076 |
30.00 |
631.25 |
631.000000 |
632.45 |
632.500000 |
4320.0 |
4461.333333 |
72 |
-0.106117 |
-0.200062 |
-0.117078 |
0.339286 |
0.392593 |
28.266667 |
True |
-15.0 |
3.0 |
31.176 |
2.900000 |
8.170952 |
11.070952 |
915 |
7 |
-0.146686 |
4420.478574 |
| 2026-03-22 11:26:14+08:00 |
167 |
686 |
Ws_W79 |
1.173076 |
30.00 |
686.23 |
686.083333 |
687.40 |
687.500000 |
4360.0 |
4486.000000 |
70 |
-0.072503 |
-0.227315 |
-0.114198 |
0.313071 |
0.360000 |
25.200000 |
True |
-8.8 |
6.0 |
30.310 |
4.037697 |
8.075394 |
12.113092 |
1050 |
11 |
-0.238771 |
4445.623028 |
| 2026-03-22 12:40:00+08:00 |
167 |
760 |
Ws_W79 |
1.173076 |
30.00 |
760.00 |
759.666667 |
761.17 |
761.333333 |
4360.0 |
4507.777778 |
70 |
-0.099667 |
-0.207682 |
-0.096914 |
0.352381 |
0.422222 |
29.555556 |
True |
-20.0 |
9.8 |
30.310 |
0.800000 |
4.983314 |
5.783314 |
1240 |
14 |
-0.233742 |
4482.861206 |