| 2026-03-12 08:02:32+08:00 |
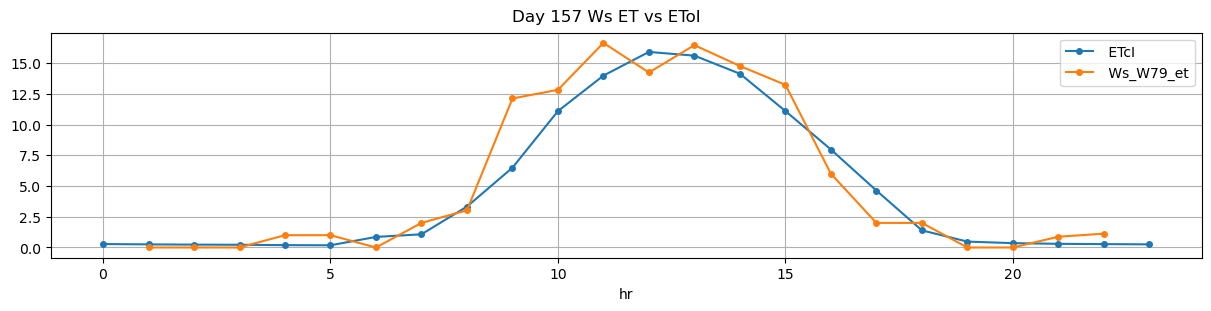
157 |
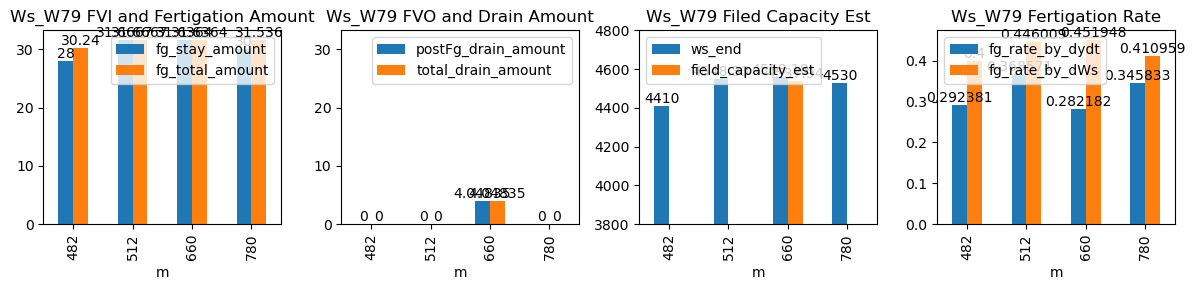
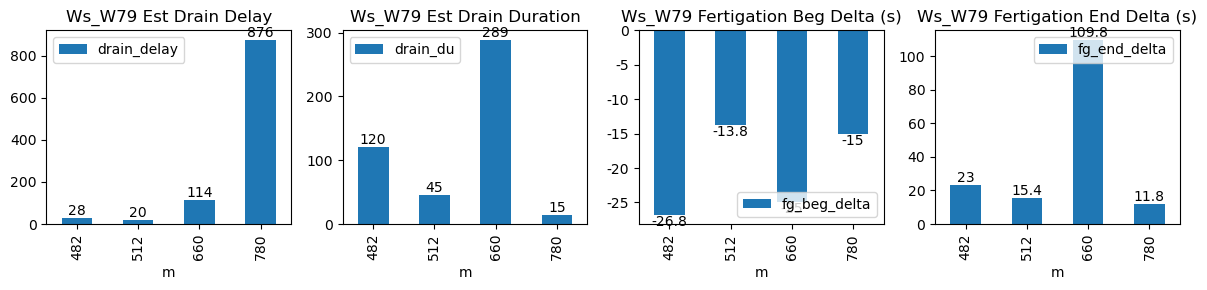
482 |
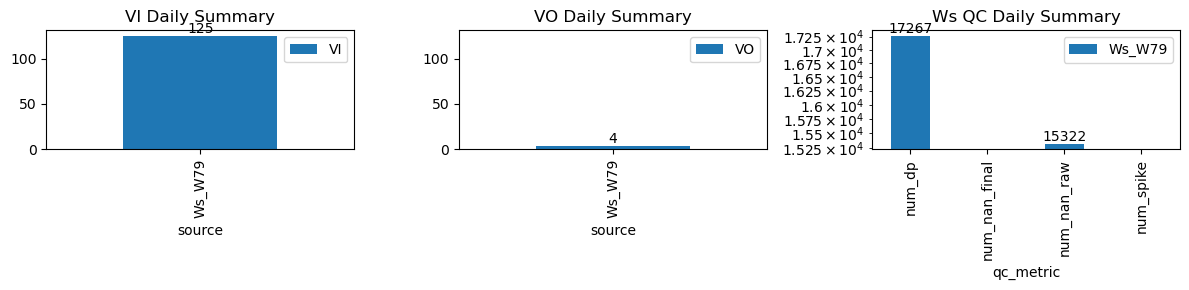
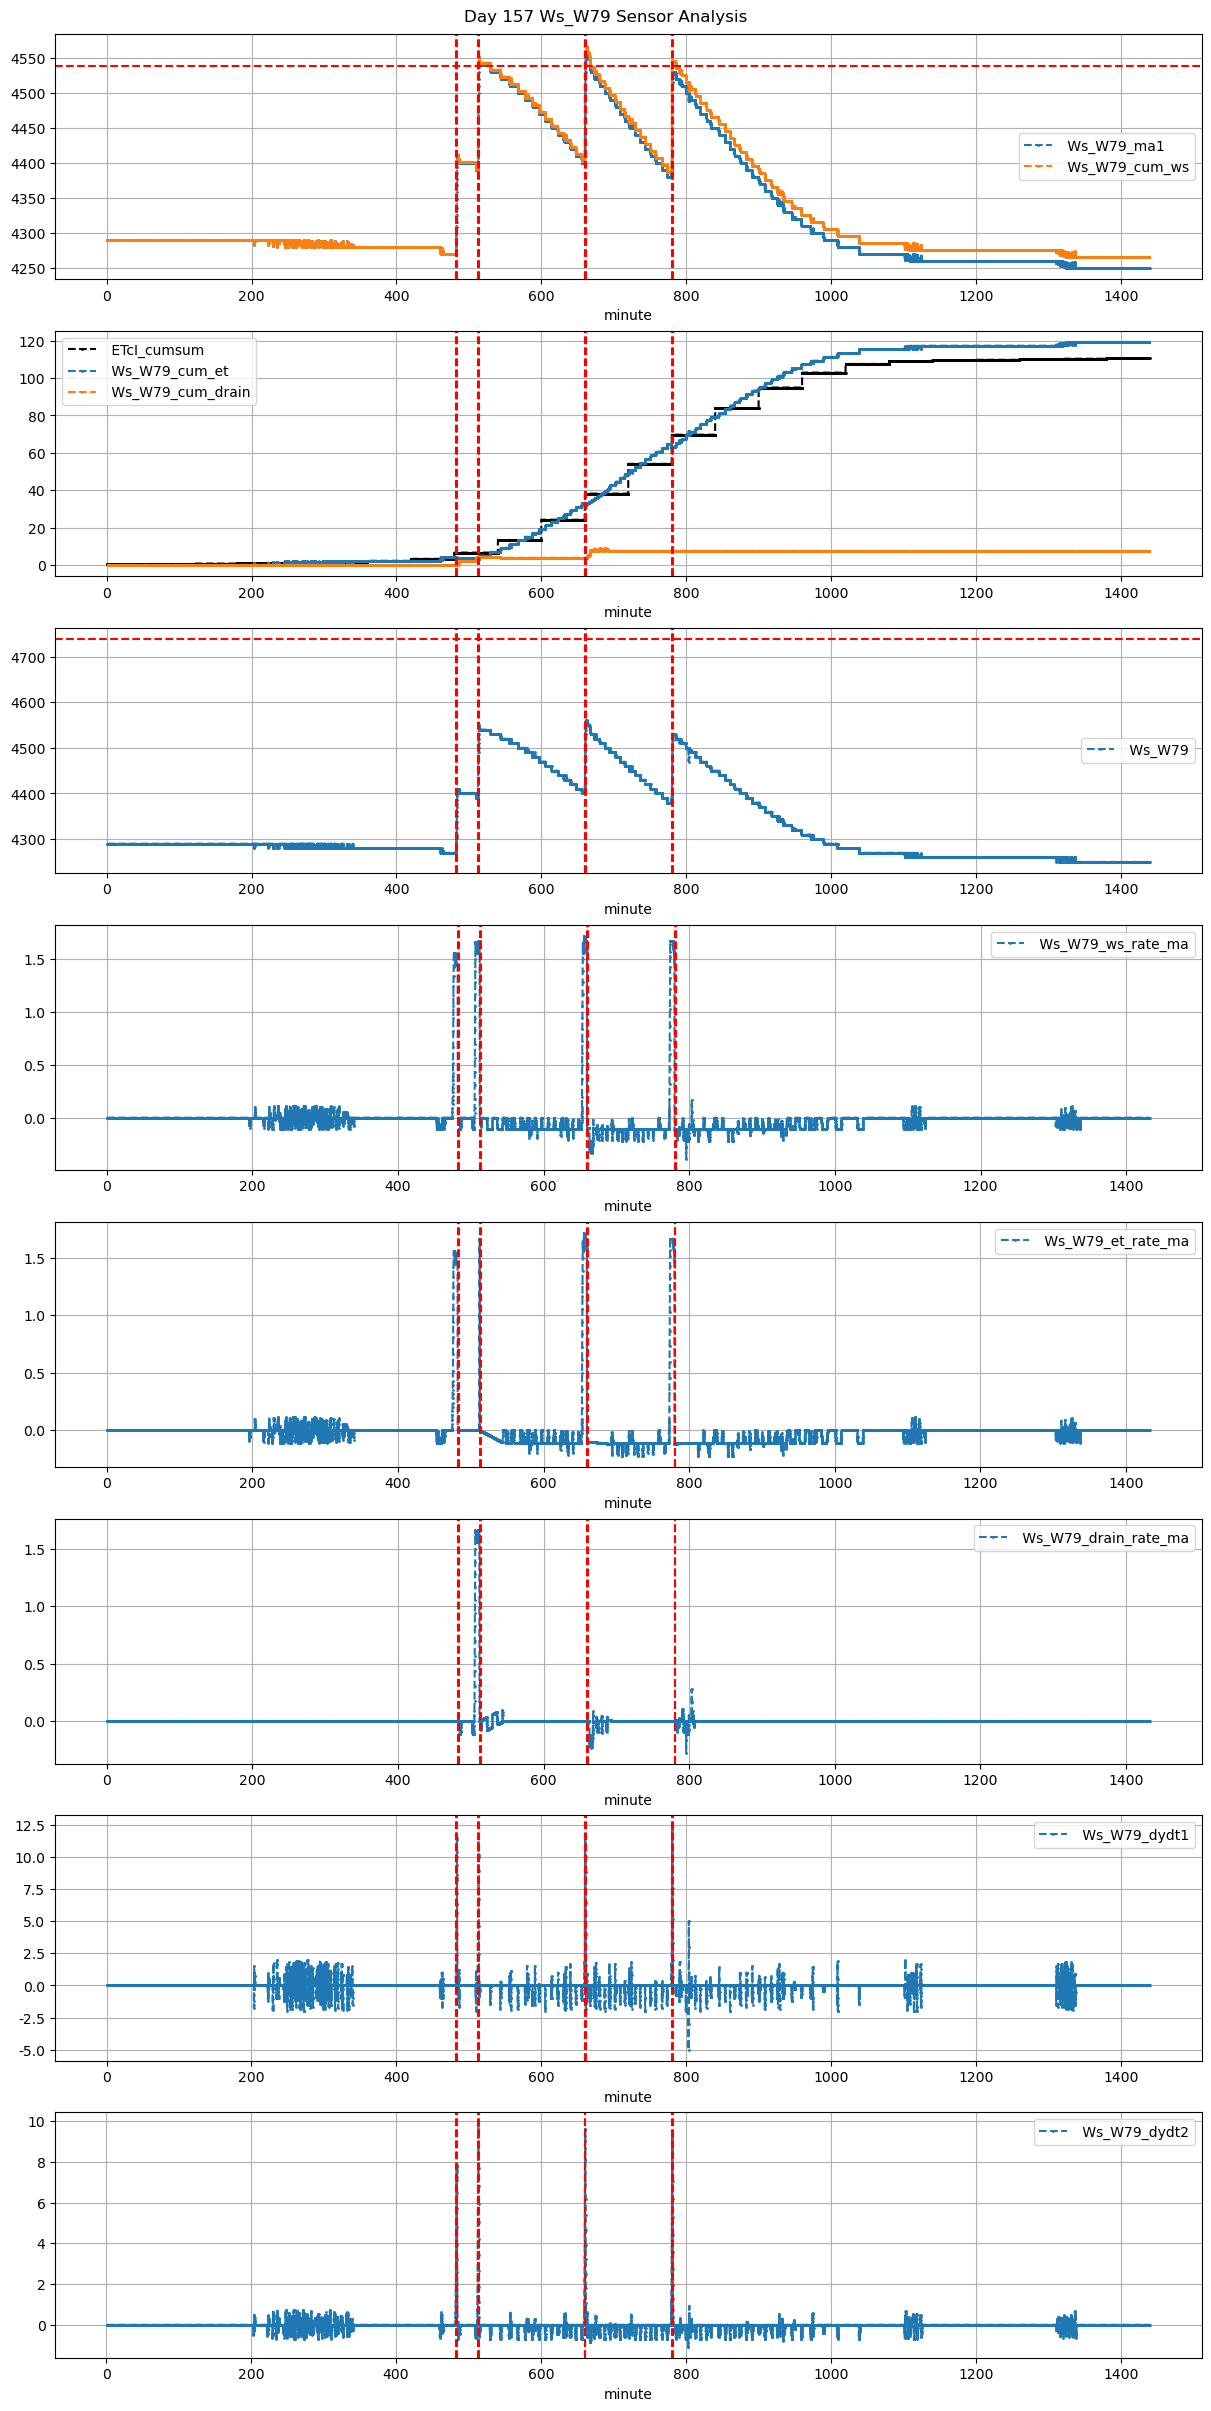
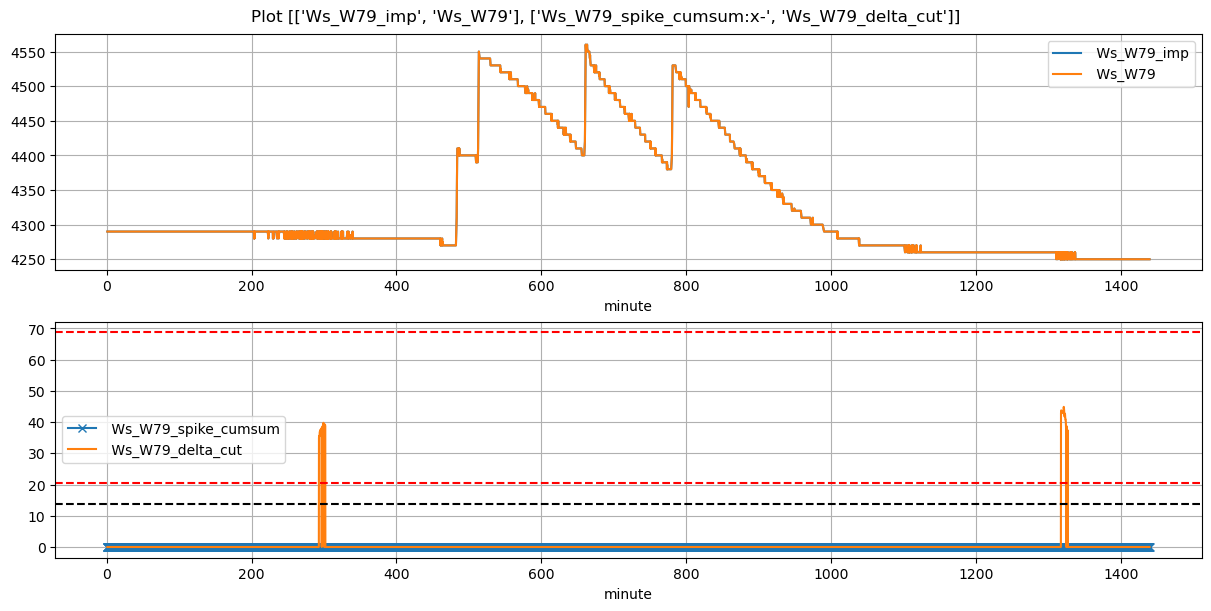
Ws_W79 |
1.039278 |
27.916667 |
482.53 |
482.083333 |
483.70 |
484.083333 |
4270.0 |
4410.000000 |
70 |
0.000000 |
-0.029630 |
0.000000 |
0.292381 |
0.400000 |
28.000000 |
True |
-26.8 |
23.0 |
30.240000 |
0.0 |
0.000000 |
0.000000 |
120 |
28 |
-0.111111 |
NaN |
| 2026-03-12 08:32:29+08:00 |
157 |
512 |
Ws_W79 |
1.039278 |
30.000000 |
512.48 |
512.250000 |
513.66 |
513.916667 |
4390.0 |
4548.333333 |
71 |
-0.045091 |
-0.006224 |
-0.104938 |
0.368571 |
0.446009 |
31.666667 |
True |
-13.8 |
15.4 |
31.666667 |
0.0 |
0.000000 |
0.000000 |
45 |
20 |
-0.074613 |
NaN |
| 2026-03-12 11:00:00+08:00 |
157 |
660 |
Ws_W79 |
1.039278 |
30.000000 |
660.00 |
659.583333 |
661.17 |
663.000000 |
4400.0 |
4558.181818 |
70 |
-0.100556 |
-0.206902 |
-0.119444 |
0.282182 |
0.451948 |
31.636364 |
True |
-25.0 |
109.8 |
31.636364 |
0.0 |
4.048348 |
4.048348 |
289 |
114 |
-0.205560 |
4537.940079 |
| 2026-03-12 13:00:00+08:00 |
157 |
780 |
Ws_W79 |
1.039278 |
30.000000 |
780.00 |
779.750000 |
781.22 |
781.416667 |
4380.0 |
4530.000000 |
73 |
-0.115897 |
-0.126440 |
-0.109259 |
0.345833 |
0.410959 |
30.000000 |
True |
-15.0 |
11.8 |
31.536000 |
0.0 |
0.000000 |
0.000000 |
15 |
876 |
-0.110064 |
NaN |