VI and VO Daily Summary
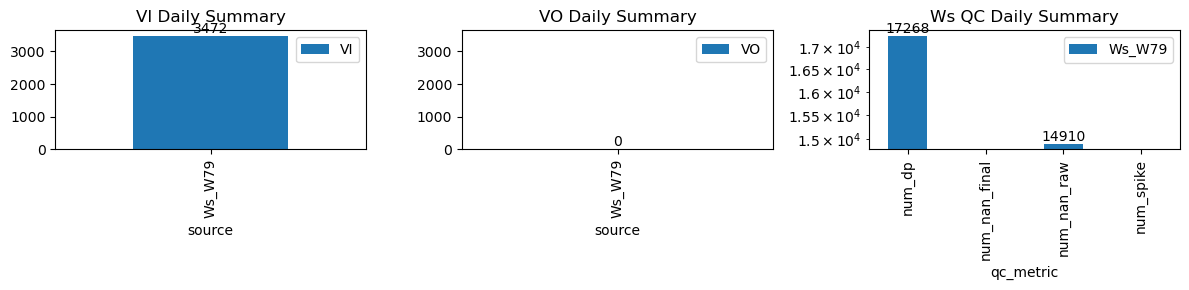
| ws_name | num_dp | num_nan_raw | num_nan_final | num_spike | cum_step_adj |
|---|---|---|---|---|---|
| Ws_W79 | 17,268 | 14,910 | 0 | 0 | 0.00 |
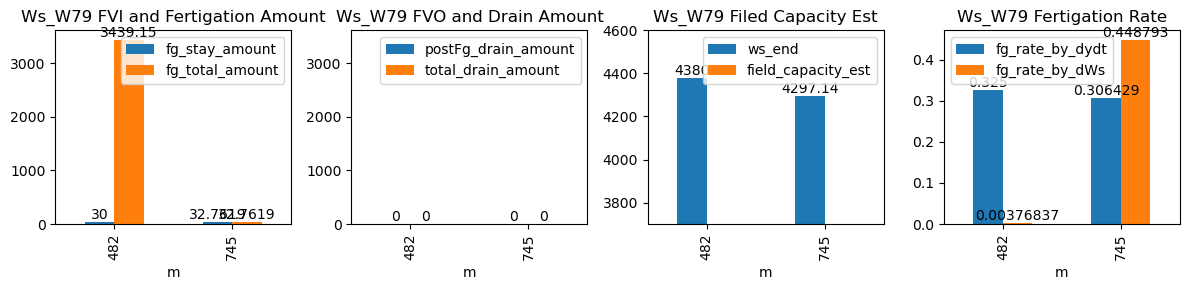
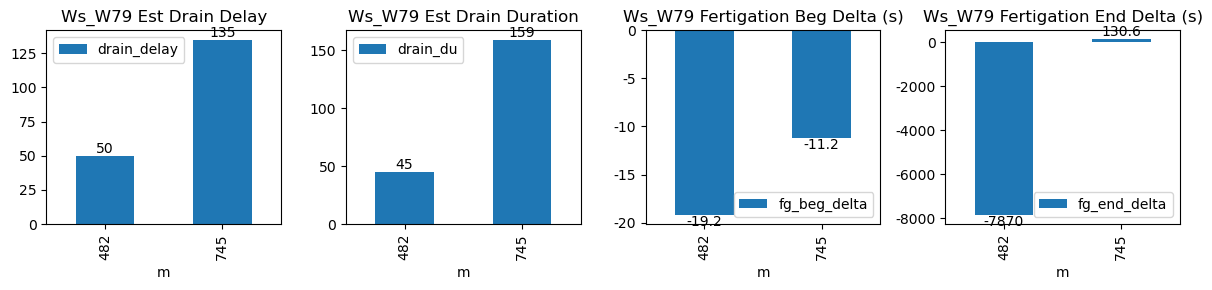
| ds | d | m | ws_name | prominence_cut | max_drain_du | fg_beg | fg_beg_est | fg_end | fg_end_est | ws_beg | ws_end | duc | pre_fg_et | post_fg_ws | post_drn_et | fg_rate_by_dydt | fg_rate_by_dWs | fg_stay_amount | enough_data | fg_beg_delta | fg_end_delta | fg_total_amount | fg_drain_amount | postFg_drain_amount | total_drain_amount | drain_du | drain_delay | drain_rate | field_capacity_est |
|---|---|---|---|---|---|---|---|---|---|---|---|---|---|---|---|---|---|---|---|---|---|---|---|---|---|---|---|---|---|
| 2026-03-13 08:02:34+08:00 | 158 | 482 | Ws_W79 | 0.731018 | 30 | 482.57 | 482.250000 | 615.25 | 483.916667 | 4230.0 | 4380.0 | 7961 | -0.002119 | -0.079104 | -0.087500 | 0.328571 | 0.003768 | 30.0 | True | -19.2 | -7880.0 | 3439.152 | 0.0 | 0 | 0.0 | 19 | 80 | -1.744076 | NaN |
| 2026-03-13 12:25:01+08:00 | 158 | 745 | Ws_W79 | 0.731018 | 30 | 745.02 | 744.833333 | 746.24 | 746.500000 | 4130.0 | 4300.0 | 73 | -0.120763 | -0.112731 | -0.106481 | 0.383929 | 0.465753 | 34.0 | True | -11.2 | 15.6 | 34.000 | 0.0 | 0 | 0.0 | 9 | 150 | -1.557602 | NaN |