| 2026-03-11 08:00:43+08:00 |
156 |
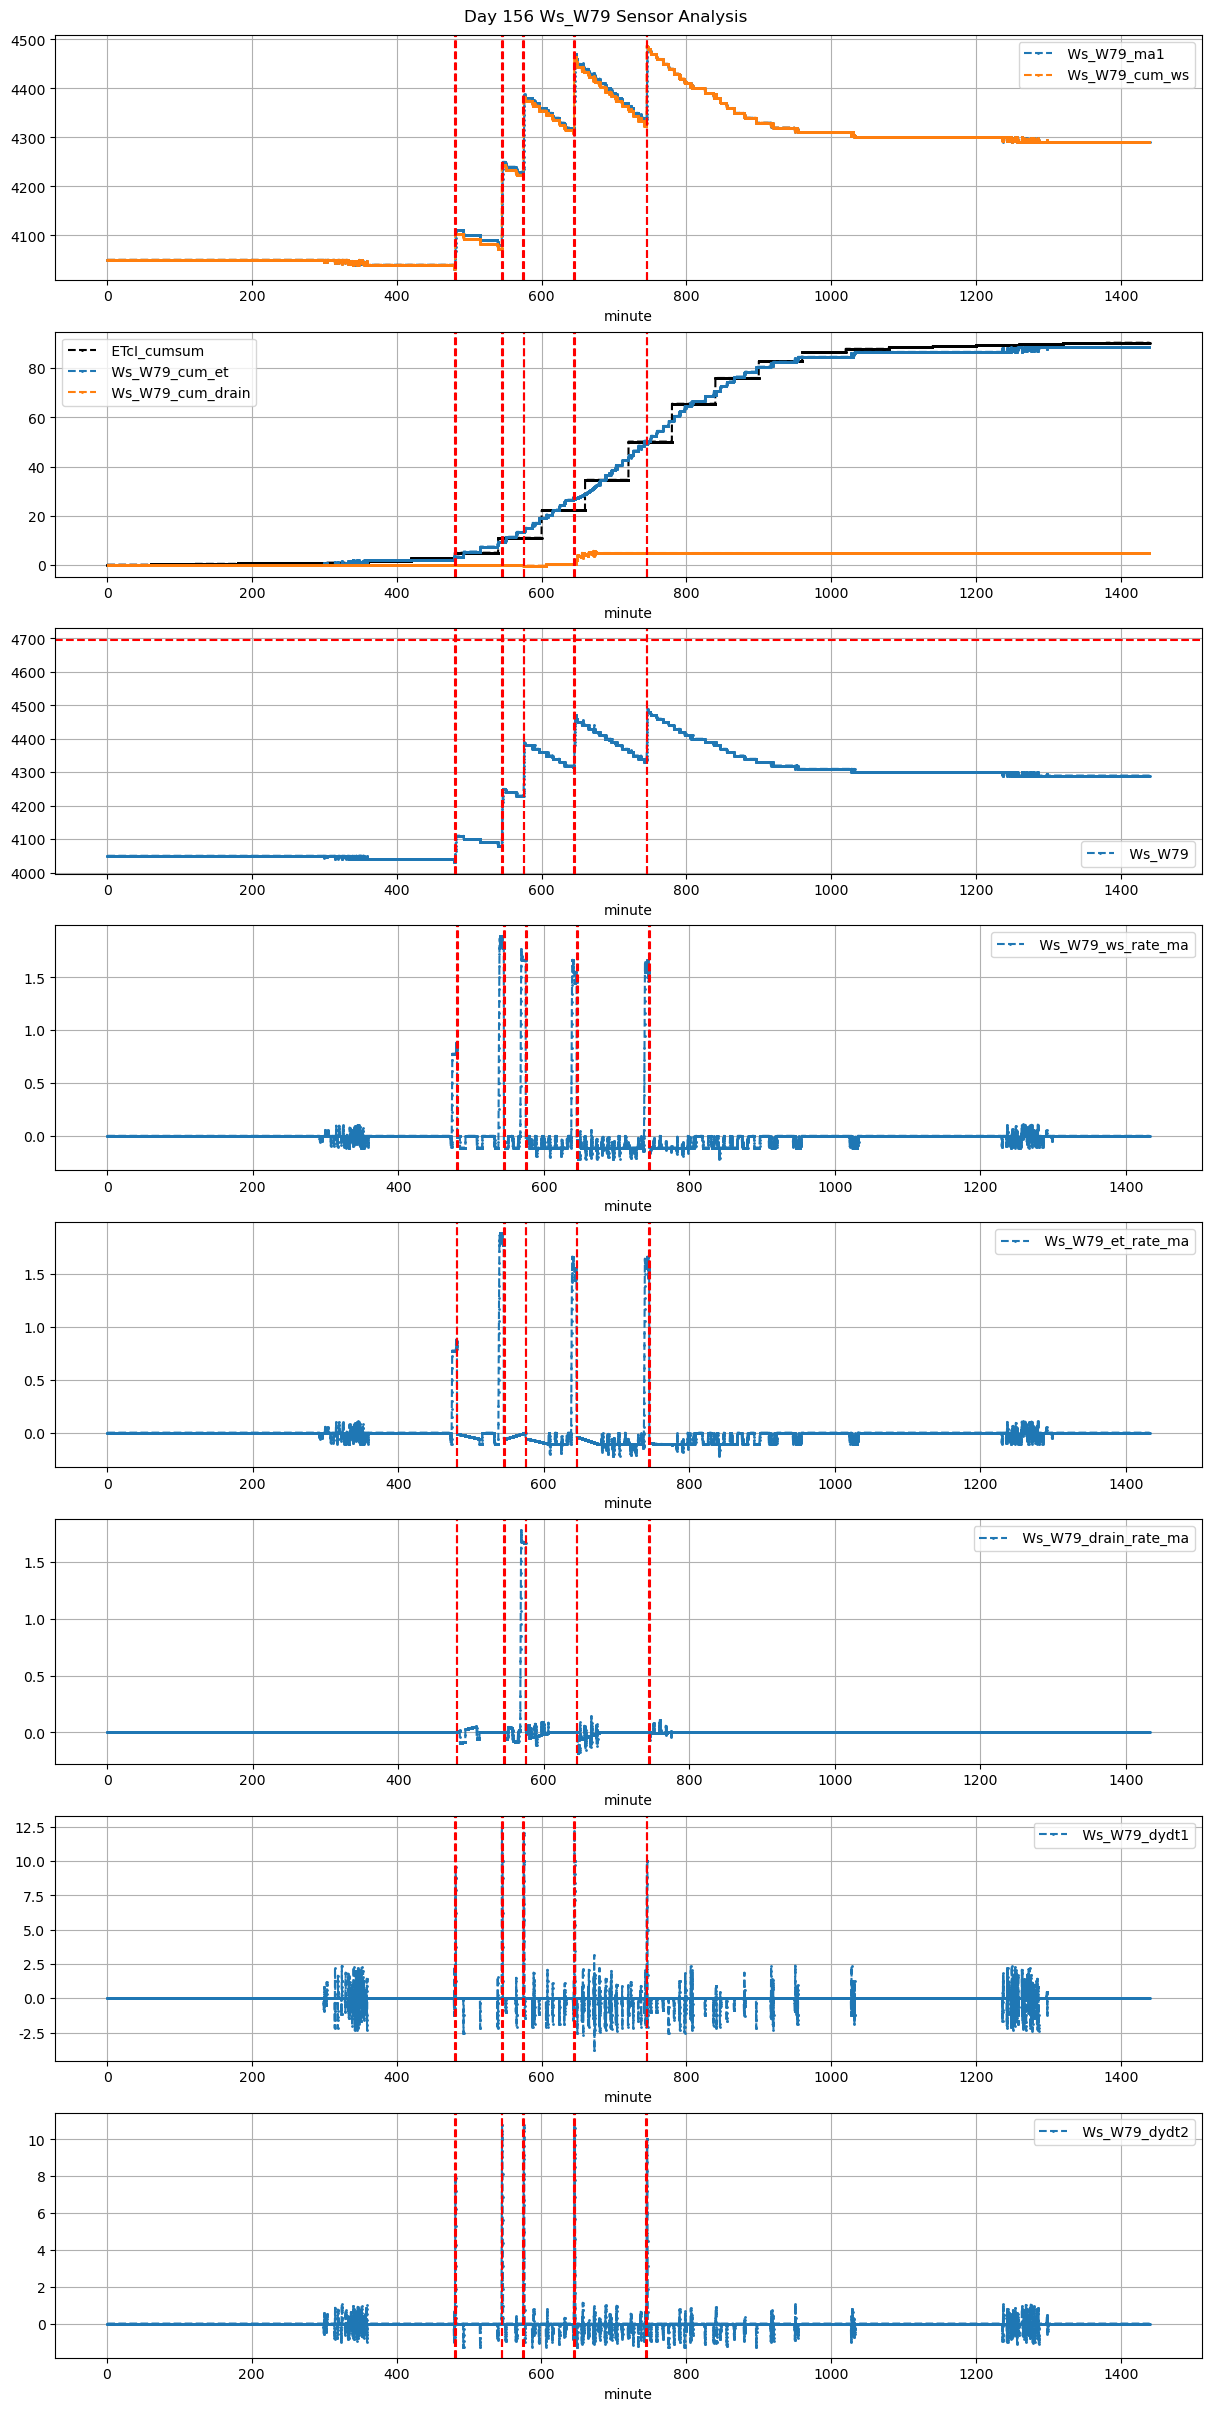
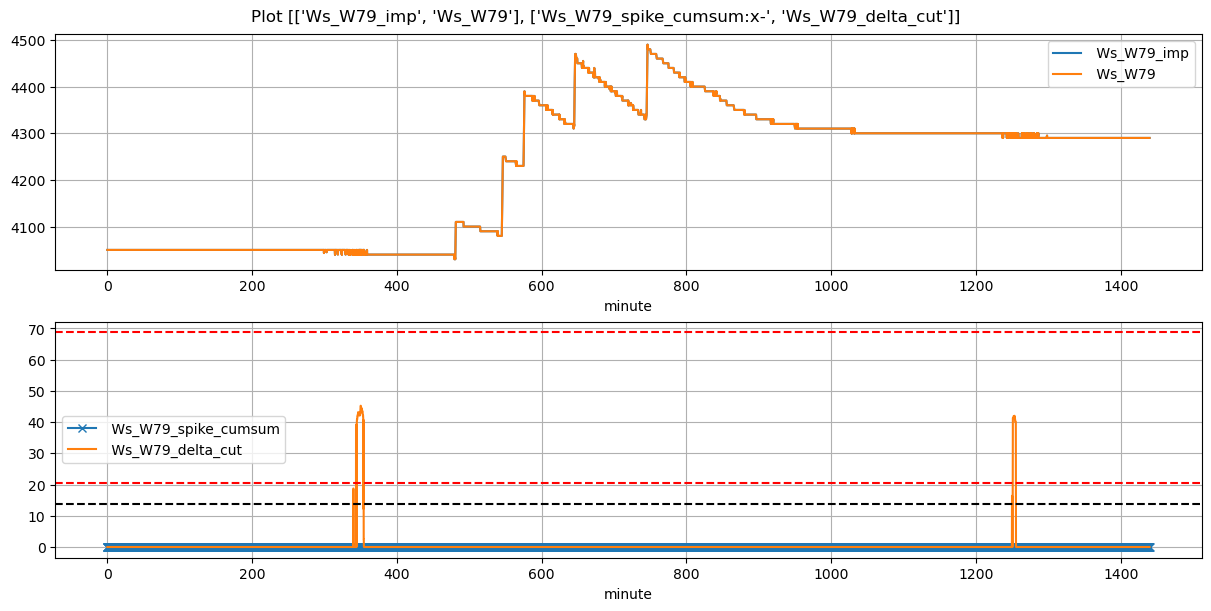
480 |
Ws_W79 |
1.492166 |
30.000000 |
480.72 |
480.833333 |
481.44 |
481.500000 |
4036.583333 |
4110.0 |
43 |
-0.026389 |
0.000000 |
-0.041667 |
0.311667 |
0.341473 |
14.683333 |
True |
6.8 |
3.6 |
18.447000 |
0.0 |
0 |
0.0 |
20 |
638 |
-2.485237 |
NaN |
| 2026-03-11 09:05:00+08:00 |
156 |
545 |
Ws_W79 |
1.492166 |
28.666667 |
545.00 |
545.000000 |
546.18 |
546.333333 |
4080.000000 |
4250.0 |
71 |
-0.148305 |
-0.137500 |
0.000000 |
0.411250 |
0.478873 |
34.000000 |
True |
0.0 |
9.2 |
34.000000 |
0.0 |
0 |
0.0 |
15 |
1159 |
-1.204701 |
NaN |
| 2026-03-11 09:35:00+08:00 |
156 |
575 |
Ws_W79 |
1.492166 |
30.000000 |
575.00 |
575.000000 |
576.17 |
576.333333 |
4230.000000 |
4390.0 |
70 |
-0.006356 |
-0.011111 |
-0.154630 |
0.416250 |
0.457143 |
32.000000 |
True |
0.0 |
9.8 |
32.000000 |
0.0 |
0 |
0.0 |
15 |
654 |
-1.922603 |
NaN |
| 2026-03-11 10:45:01+08:00 |
156 |
645 |
Ws_W79 |
1.492166 |
30.000000 |
645.02 |
645.000000 |
646.20 |
646.333333 |
4317.357143 |
4470.0 |
71 |
-0.023305 |
-0.168056 |
-0.084226 |
0.405000 |
0.429980 |
30.528571 |
True |
-1.2 |
8.0 |
30.528571 |
0.0 |
0 |
0.0 |
19 |
187 |
-2.470425 |
NaN |
| 2026-03-11 12:25:01+08:00 |
156 |
745 |
Ws_W79 |
1.492166 |
30.000000 |
745.02 |
744.916667 |
746.24 |
746.333333 |
4330.000000 |
4490.0 |
73 |
-0.110546 |
-0.147222 |
-0.133333 |
0.400000 |
0.438356 |
32.000000 |
True |
-6.2 |
5.6 |
32.000000 |
0.0 |
0 |
0.0 |
15 |
20 |
-1.846039 |
NaN |