| 2026-03-31 07:35:41+08:00 |
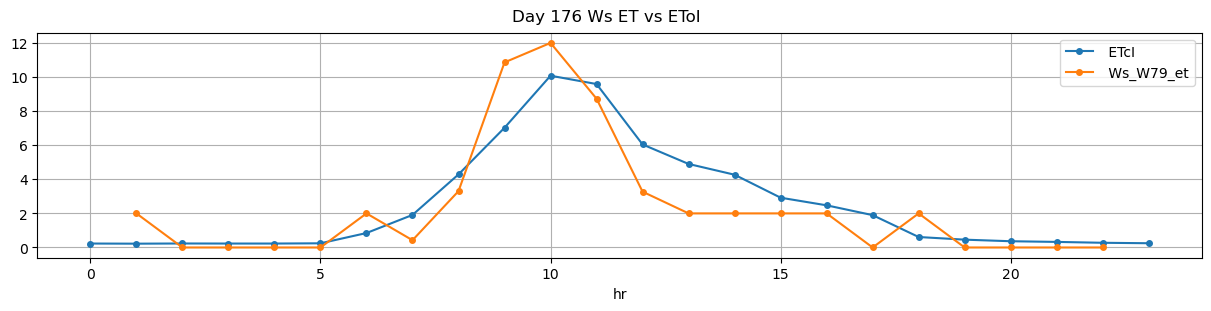
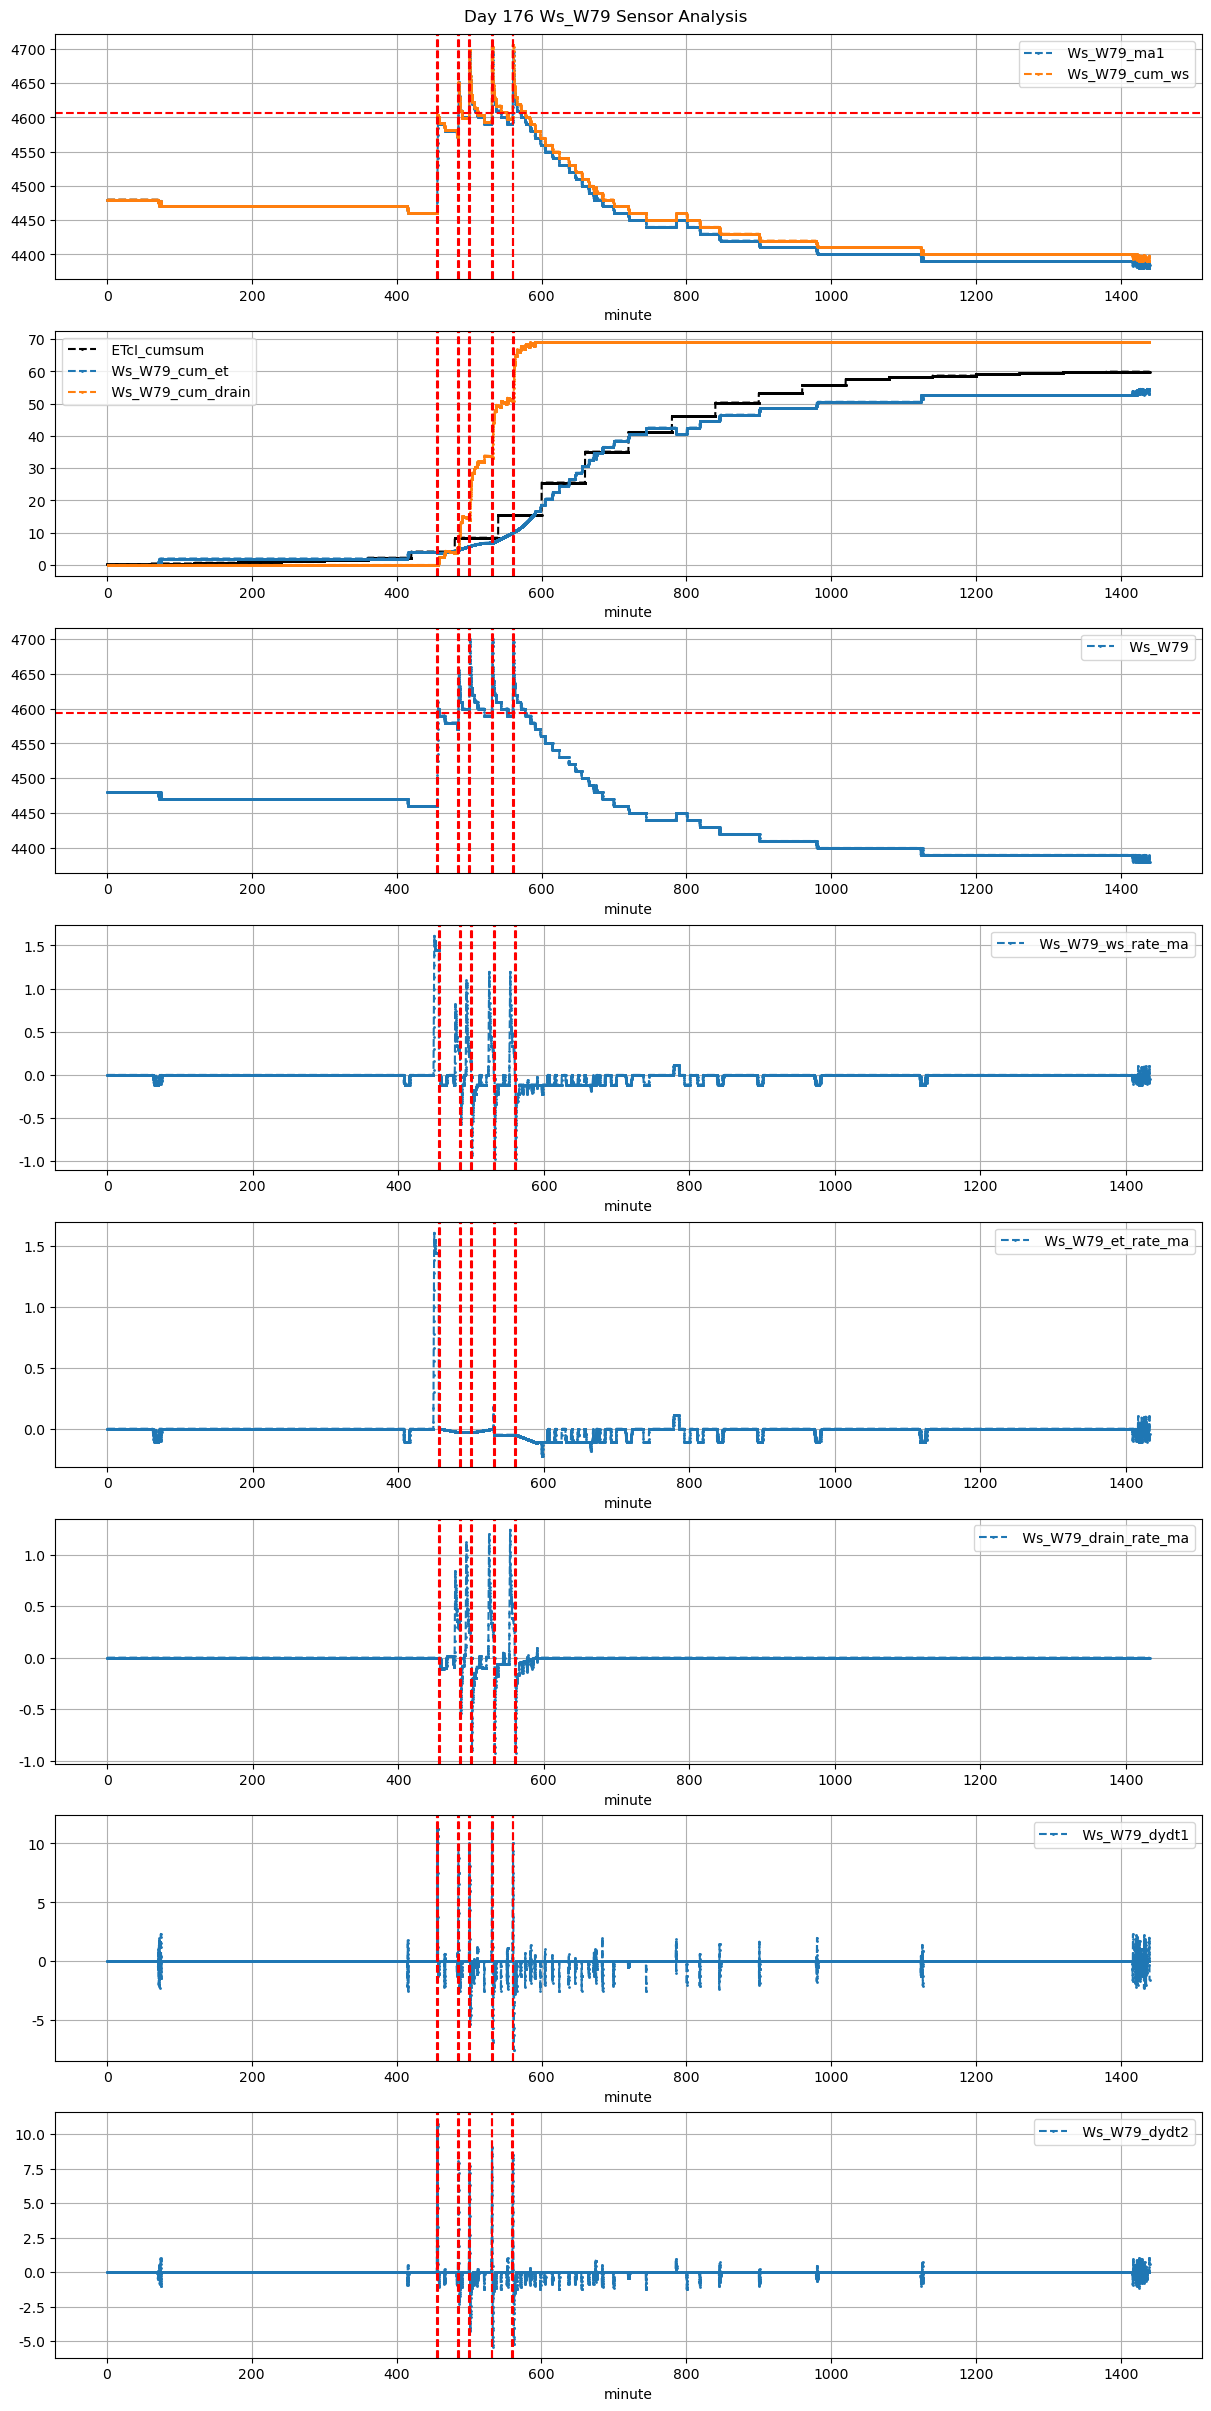
176 |
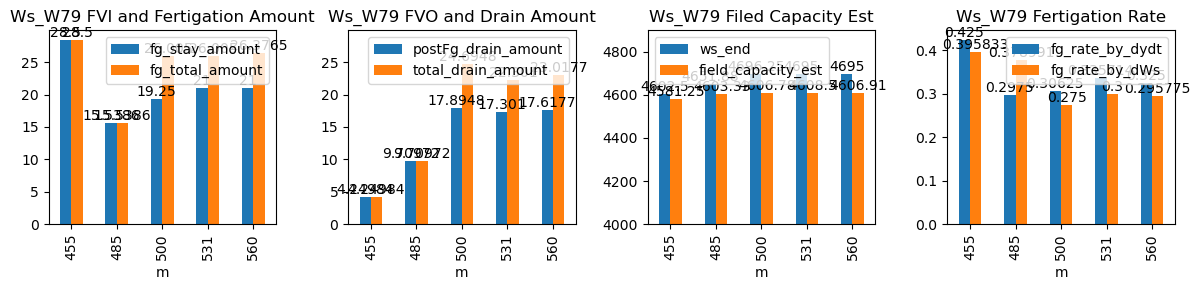
455 |
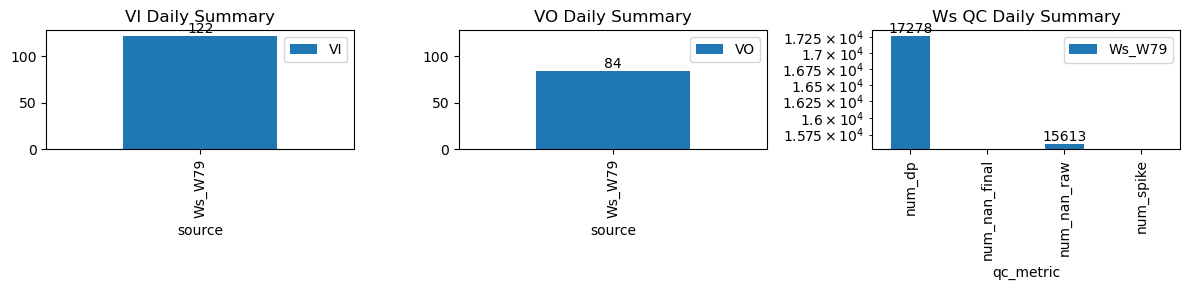
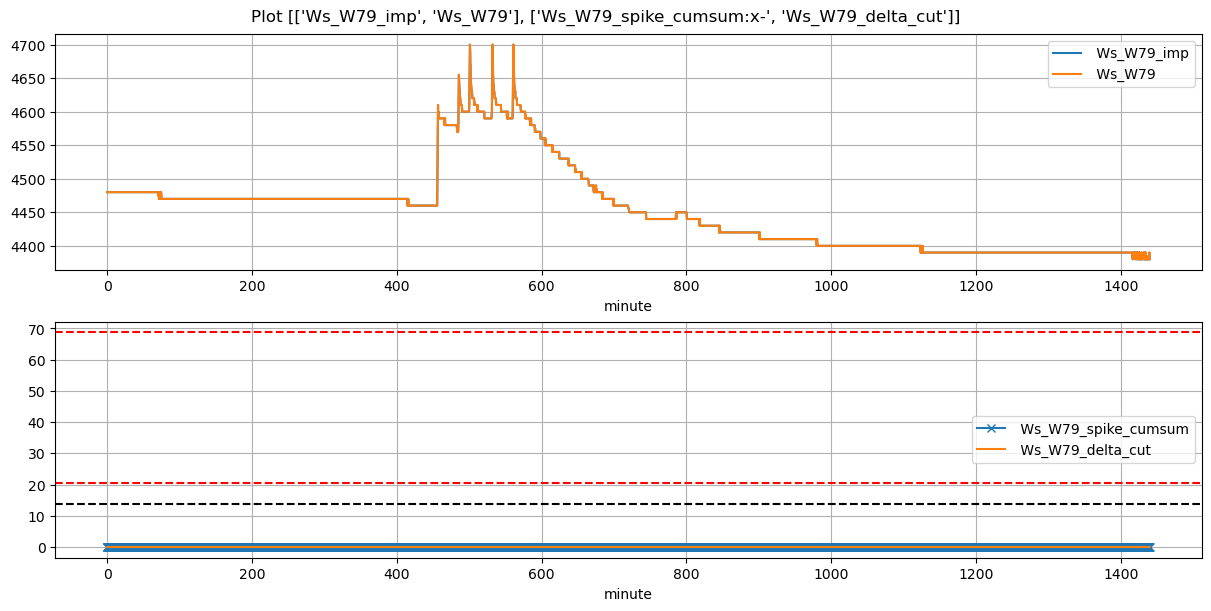
Ws_W79 |
3.458793 |
28.000000 |
455.68 |
455.750000 |
456.88 |
457.000000 |
4460.000000 |
4602.500 |
72 |
0.000000 |
-0.102469 |
0.000000 |
0.425000 |
0.395833 |
28.500000 |
True |
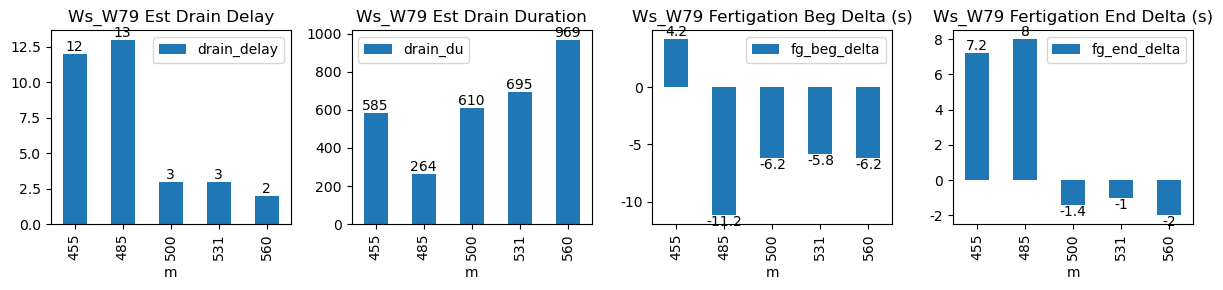
4.2 |
7.2 |
28.500000 |
0.0 |
4.249837 |
4.249837 |
585 |
12 |
-0.110394 |
4581.250815 |
| 2026-03-31 08:05:01+08:00 |
176 |
485 |
Ws_W79 |
3.458793 |
14.166667 |
485.02 |
484.833333 |
485.70 |
485.833333 |
4574.181818 |
4651.875 |
41 |
-0.029771 |
-0.080556 |
0.000000 |
0.297500 |
0.378991 |
15.538636 |
True |
-11.2 |
8.0 |
15.538636 |
0.0 |
9.709723 |
9.709723 |
264 |
13 |
-0.467451 |
4603.326385 |
| 2026-03-31 08:20:01+08:00 |
176 |
500 |
Ws_W79 |
3.458793 |
29.810000 |
500.02 |
499.916667 |
501.19 |
501.166667 |
4600.000000 |
4696.250 |
70 |
-0.029771 |
-0.270370 |
0.000000 |
0.306250 |
0.275000 |
19.250000 |
True |
-6.2 |
-1.4 |
26.005000 |
6.8 |
17.894823 |
24.694823 |
610 |
3 |
-0.400135 |
4606.775886 |
| 2026-03-31 08:51:11+08:00 |
176 |
531 |
Ws_W79 |
3.458793 |
27.650000 |
531.18 |
531.083333 |
532.35 |
532.333333 |
4590.000000 |
4695.000 |
70 |
-0.048774 |
-0.220370 |
0.000000 |
0.335714 |
0.300000 |
21.000000 |
True |
-5.8 |
-1.0 |
26.005000 |
5.0 |
17.300999 |
22.300999 |
695 |
3 |
-0.322059 |
4608.495006 |
| 2026-03-31 09:20:01+08:00 |
176 |
560 |
Ws_W79 |
3.458793 |
30.000000 |
560.02 |
559.916667 |
561.20 |
561.166667 |
4590.000000 |
4695.000 |
71 |
-0.048774 |
-0.247531 |
-0.117541 |
0.325000 |
0.295775 |
21.000000 |
True |
-6.2 |
-2.0 |
26.376500 |
5.4 |
17.617740 |
23.017740 |
969 |
2 |
-0.248236 |
4606.911298 |