| 2026-04-01 07:46:10+08:00 |
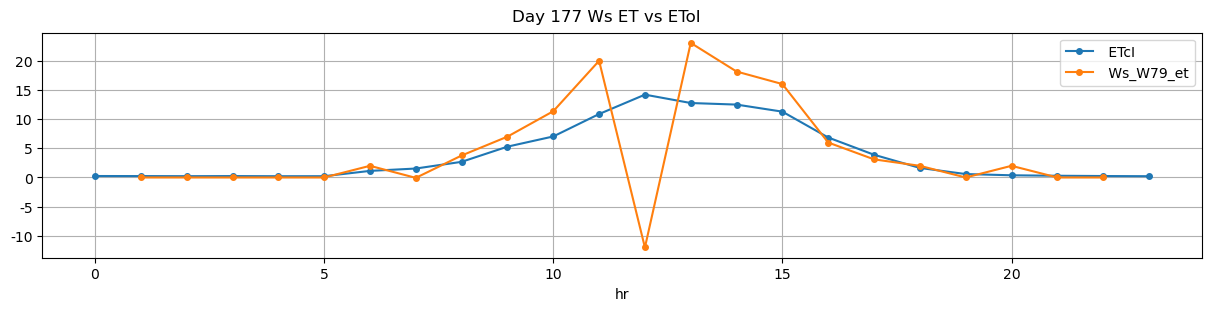
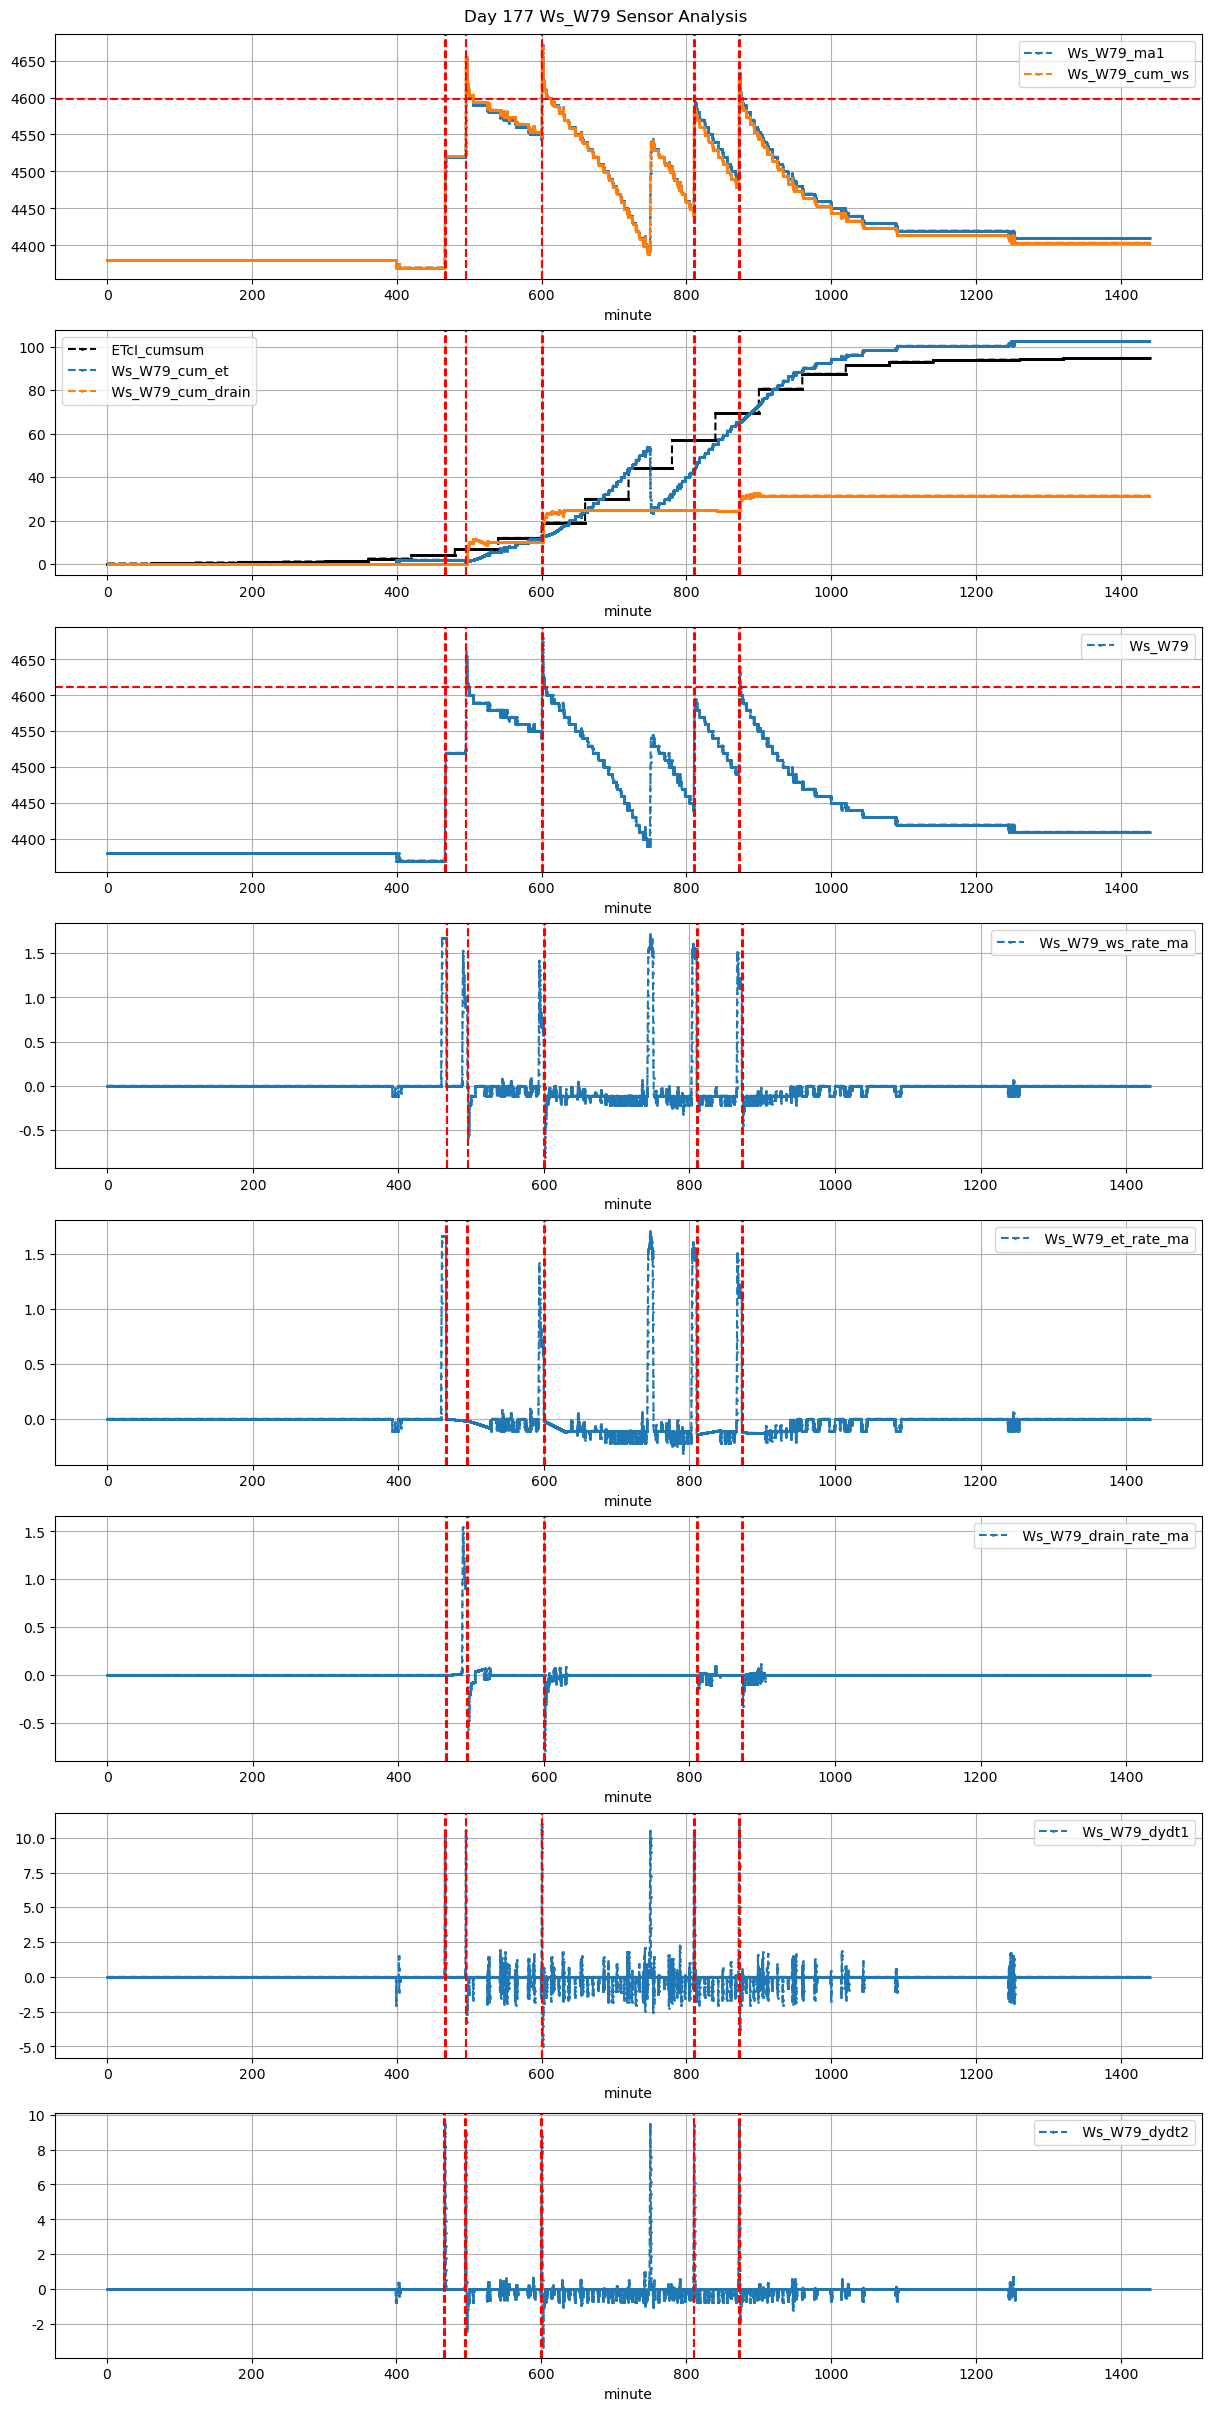
177 |
466 |
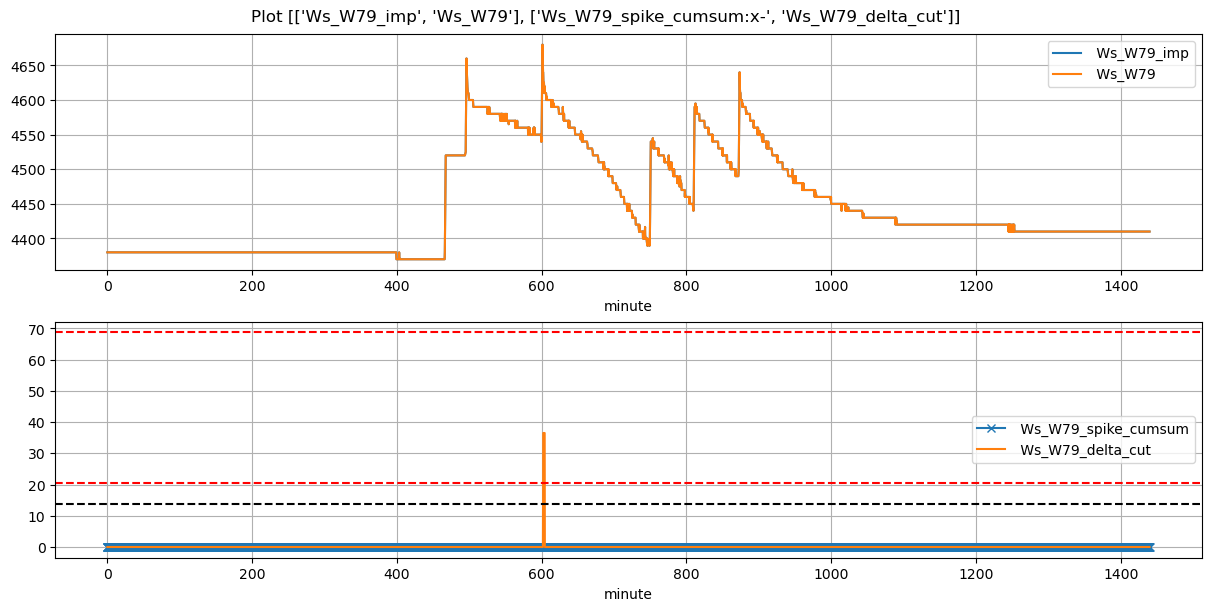
Ws_W79 |
1.50216 |
27.583333 |
466.17 |
465.916667 |
467.35 |
467.416667 |
4370.000000 |
4520.0 |
71 |
0.000000 |
0.000000 |
0.000000 |
0.352857 |
0.422535 |
30.000000 |
True |
-15.2 |
4.0 |
30.000000 |
0.0 |
0.000000 |
0.000000 |
NaN |
NaN |
NaN |
NaN |
| 2026-04-01 08:15:00+08:00 |
177 |
495 |
Ws_W79 |
1.50216 |
30.000000 |
495.00 |
494.750000 |
496.17 |
496.166667 |
4520.000000 |
4660.0 |
70 |
0.000000 |
-0.259722 |
-0.101389 |
0.328489 |
0.400000 |
28.000000 |
True |
-15.0 |
-0.2 |
28.000000 |
0.0 |
0.000000 |
0.000000 |
114.0 |
14.0 |
-2.347113 |
NaN |
| 2026-04-01 10:00:00+08:00 |
177 |
600 |
Ws_W79 |
1.50216 |
30.000000 |
600.00 |
599.833333 |
601.18 |
601.166667 |
4550.000000 |
4680.0 |
71 |
-0.019068 |
-0.368353 |
-0.156944 |
0.324643 |
0.366197 |
26.000000 |
True |
-10.0 |
-0.8 |
26.376500 |
0.4 |
13.699772 |
14.099772 |
94.0 |
9.0 |
-2.864195 |
4611.501142 |
| 2026-04-01 13:30:01+08:00 |
177 |
810 |
Ws_W79 |
1.50216 |
30.000000 |
810.02 |
809.750000 |
811.19 |
812.500000 |
4449.666667 |
4595.0 |
70 |
-0.167655 |
-0.209653 |
-0.120833 |
0.308619 |
0.415238 |
29.066667 |
True |
-16.2 |
78.6 |
29.066667 |
0.0 |
0.000000 |
0.000000 |
30.0 |
393.0 |
-1.586283 |
NaN |
| 2026-04-01 14:32:11+08:00 |
177 |
872 |
Ws_W79 |
1.50216 |
30.000000 |
872.18 |
871.916667 |
873.36 |
873.416667 |
4490.000000 |
4640.0 |
71 |
-0.131659 |
-0.246875 |
-0.137130 |
0.339082 |
0.422535 |
30.000000 |
True |
-15.8 |
3.4 |
30.000000 |
0.0 |
0.000000 |
0.000000 |
45.0 |
13.0 |
-2.568209 |
NaN |