VI and VO Daily Summary
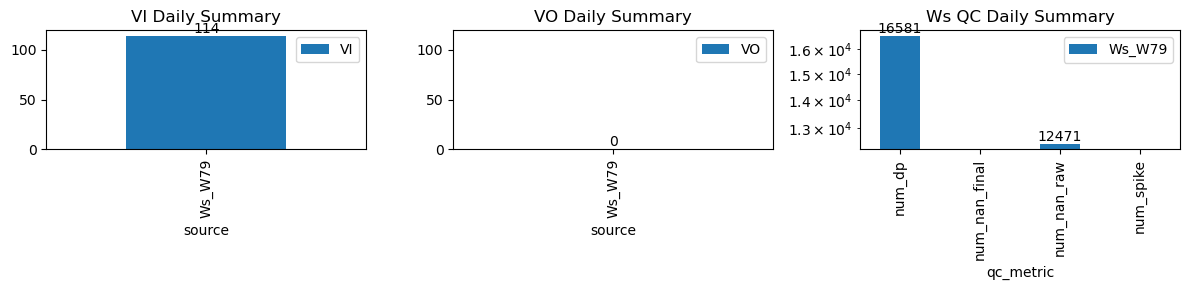
| ws_name | num_dp | num_nan_raw | num_nan_final | num_spike | cum_step_adj |
|---|---|---|---|---|---|
| Ws_W79 | 16,581 | 12,471 | 0 | 0 | 0.00 |
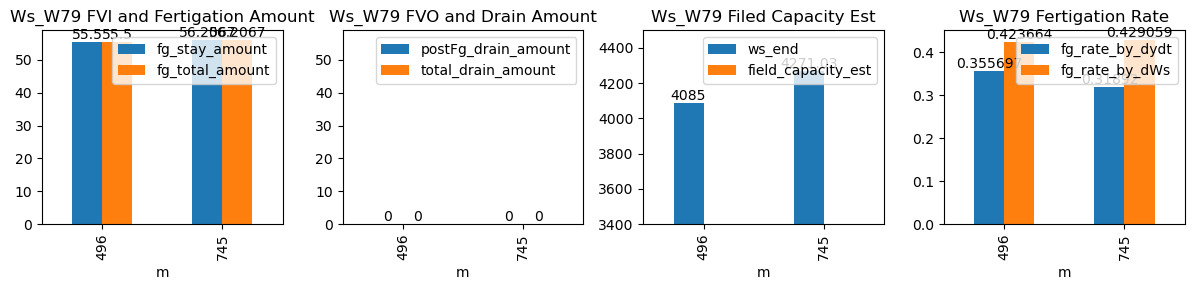
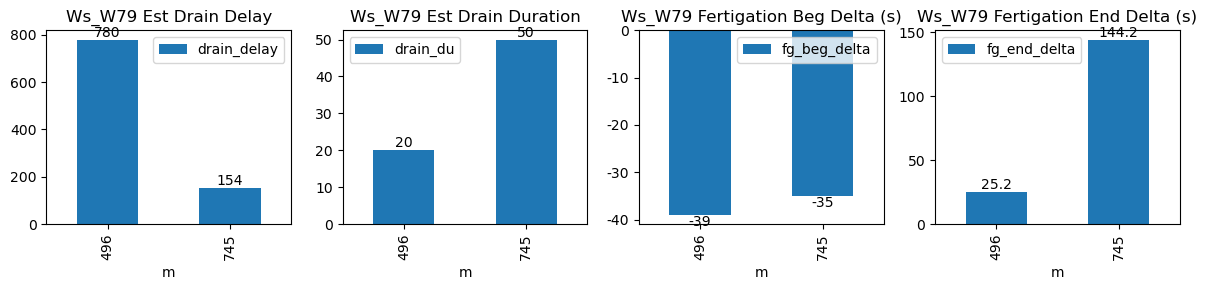
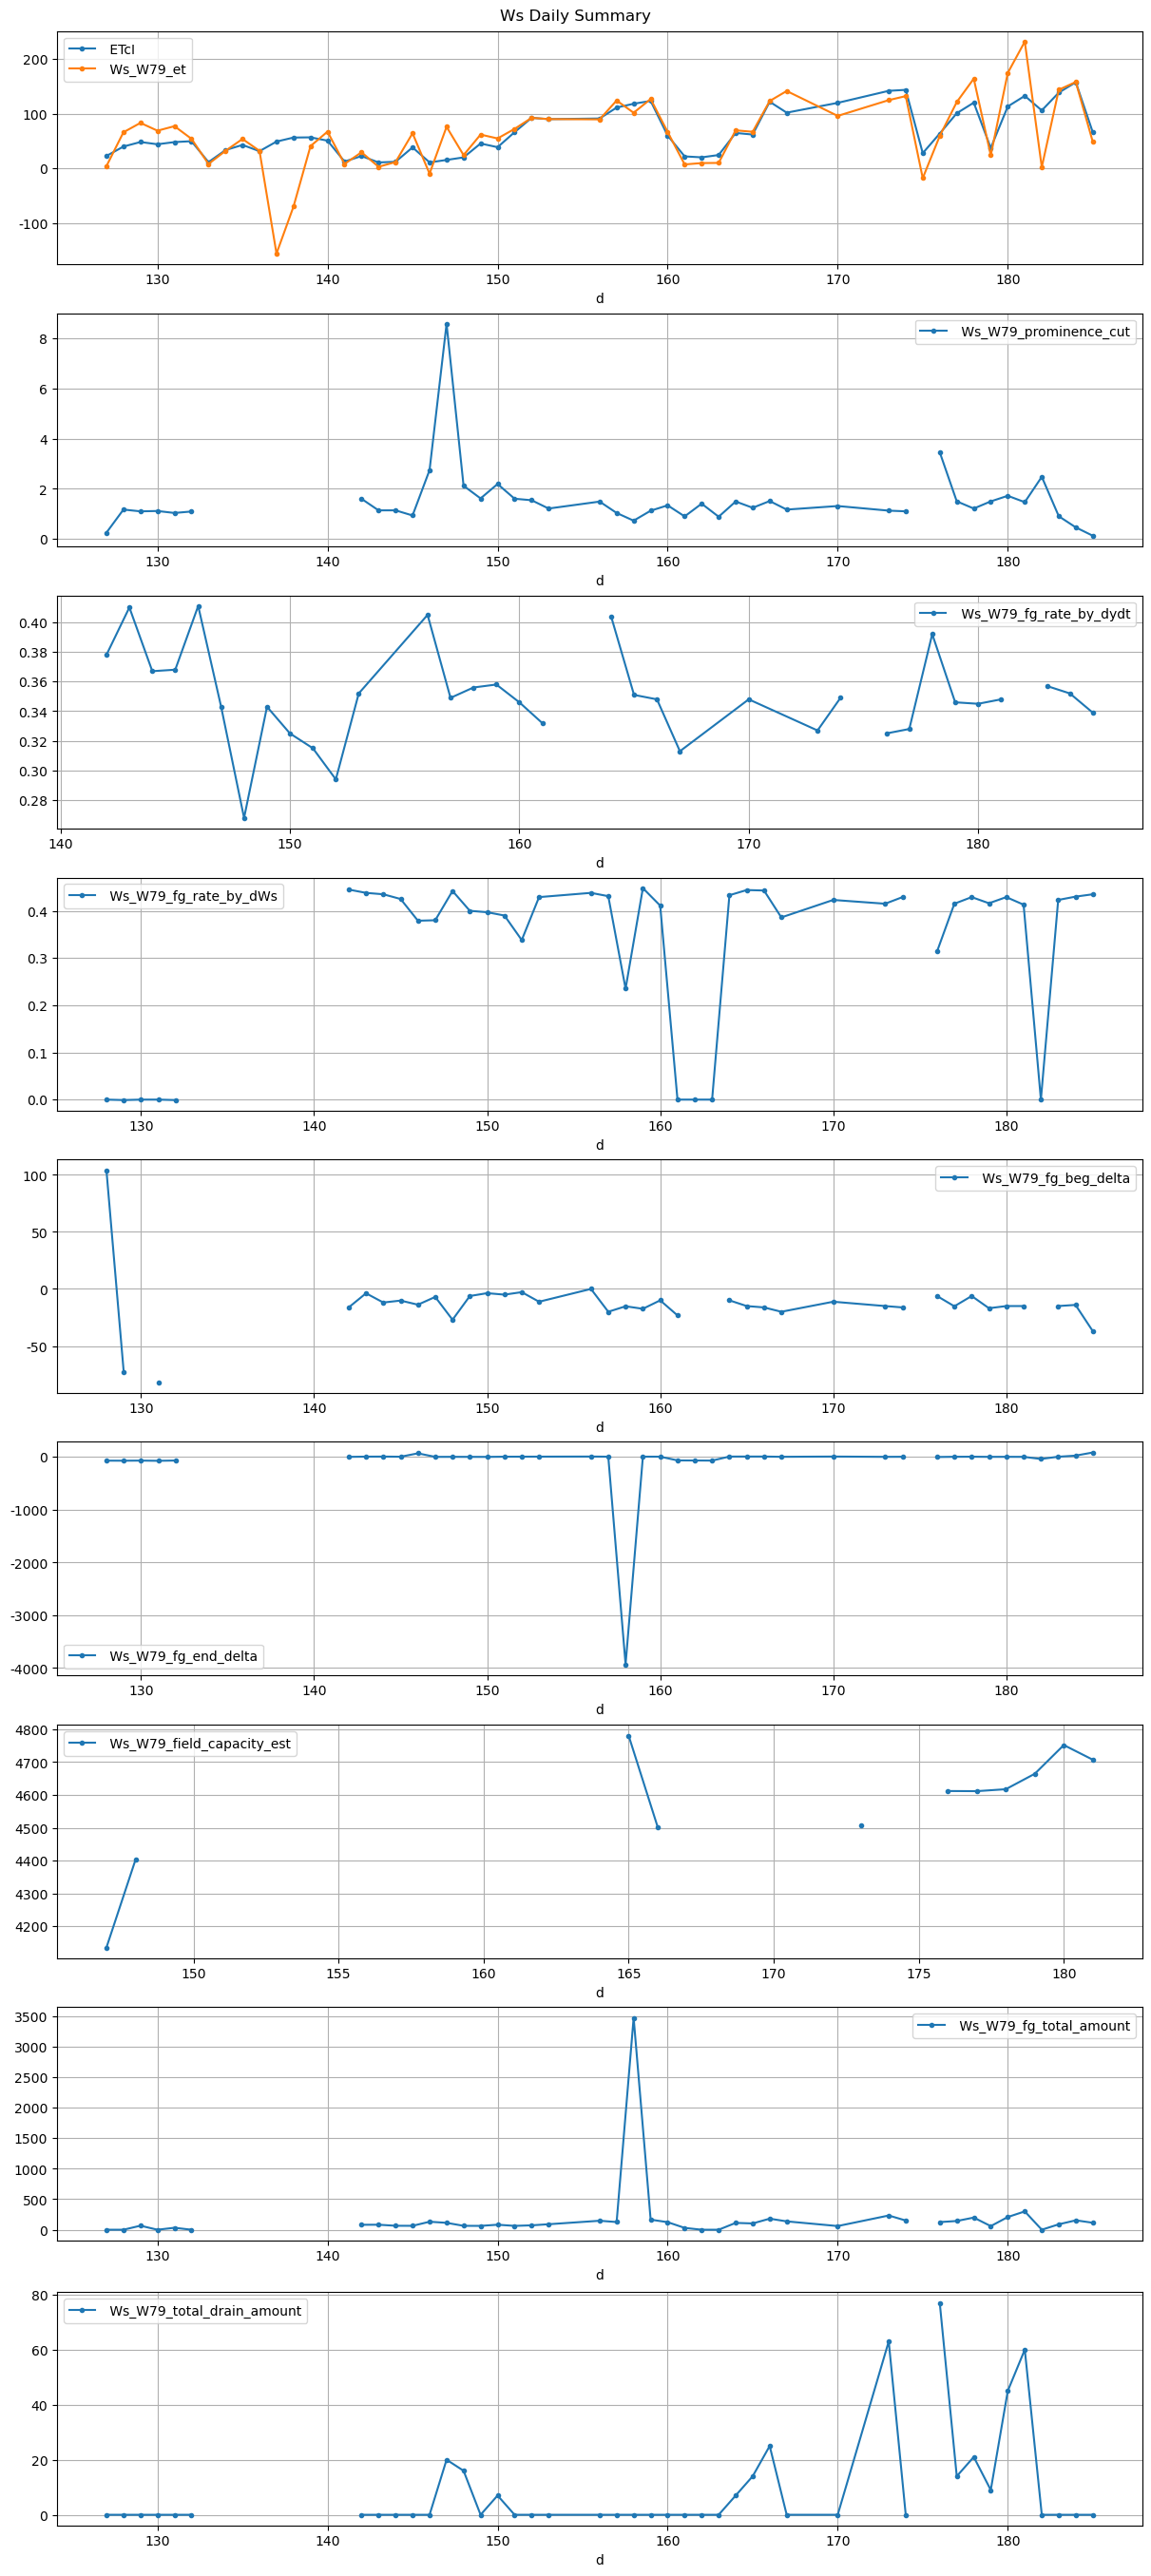
| ds | d | m | ws_name | prominence_cut | max_drain_du | fg_beg | fg_beg_est | fg_end | fg_end_est | ws_beg | ws_end | duc | pre_fg_et | post_fg_ws | post_drn_et | fg_rate_by_dydt | fg_rate_by_dWs | fg_stay_amount | enough_data | fg_beg_delta | fg_end_delta | fg_total_amount | fg_drain_amount | postFg_drain_amount | total_drain_amount | drain_du | drain_delay | drain_rate | field_capacity_est |
|---|---|---|---|---|---|---|---|---|---|---|---|---|---|---|---|---|---|---|---|---|---|---|---|---|---|---|---|---|---|
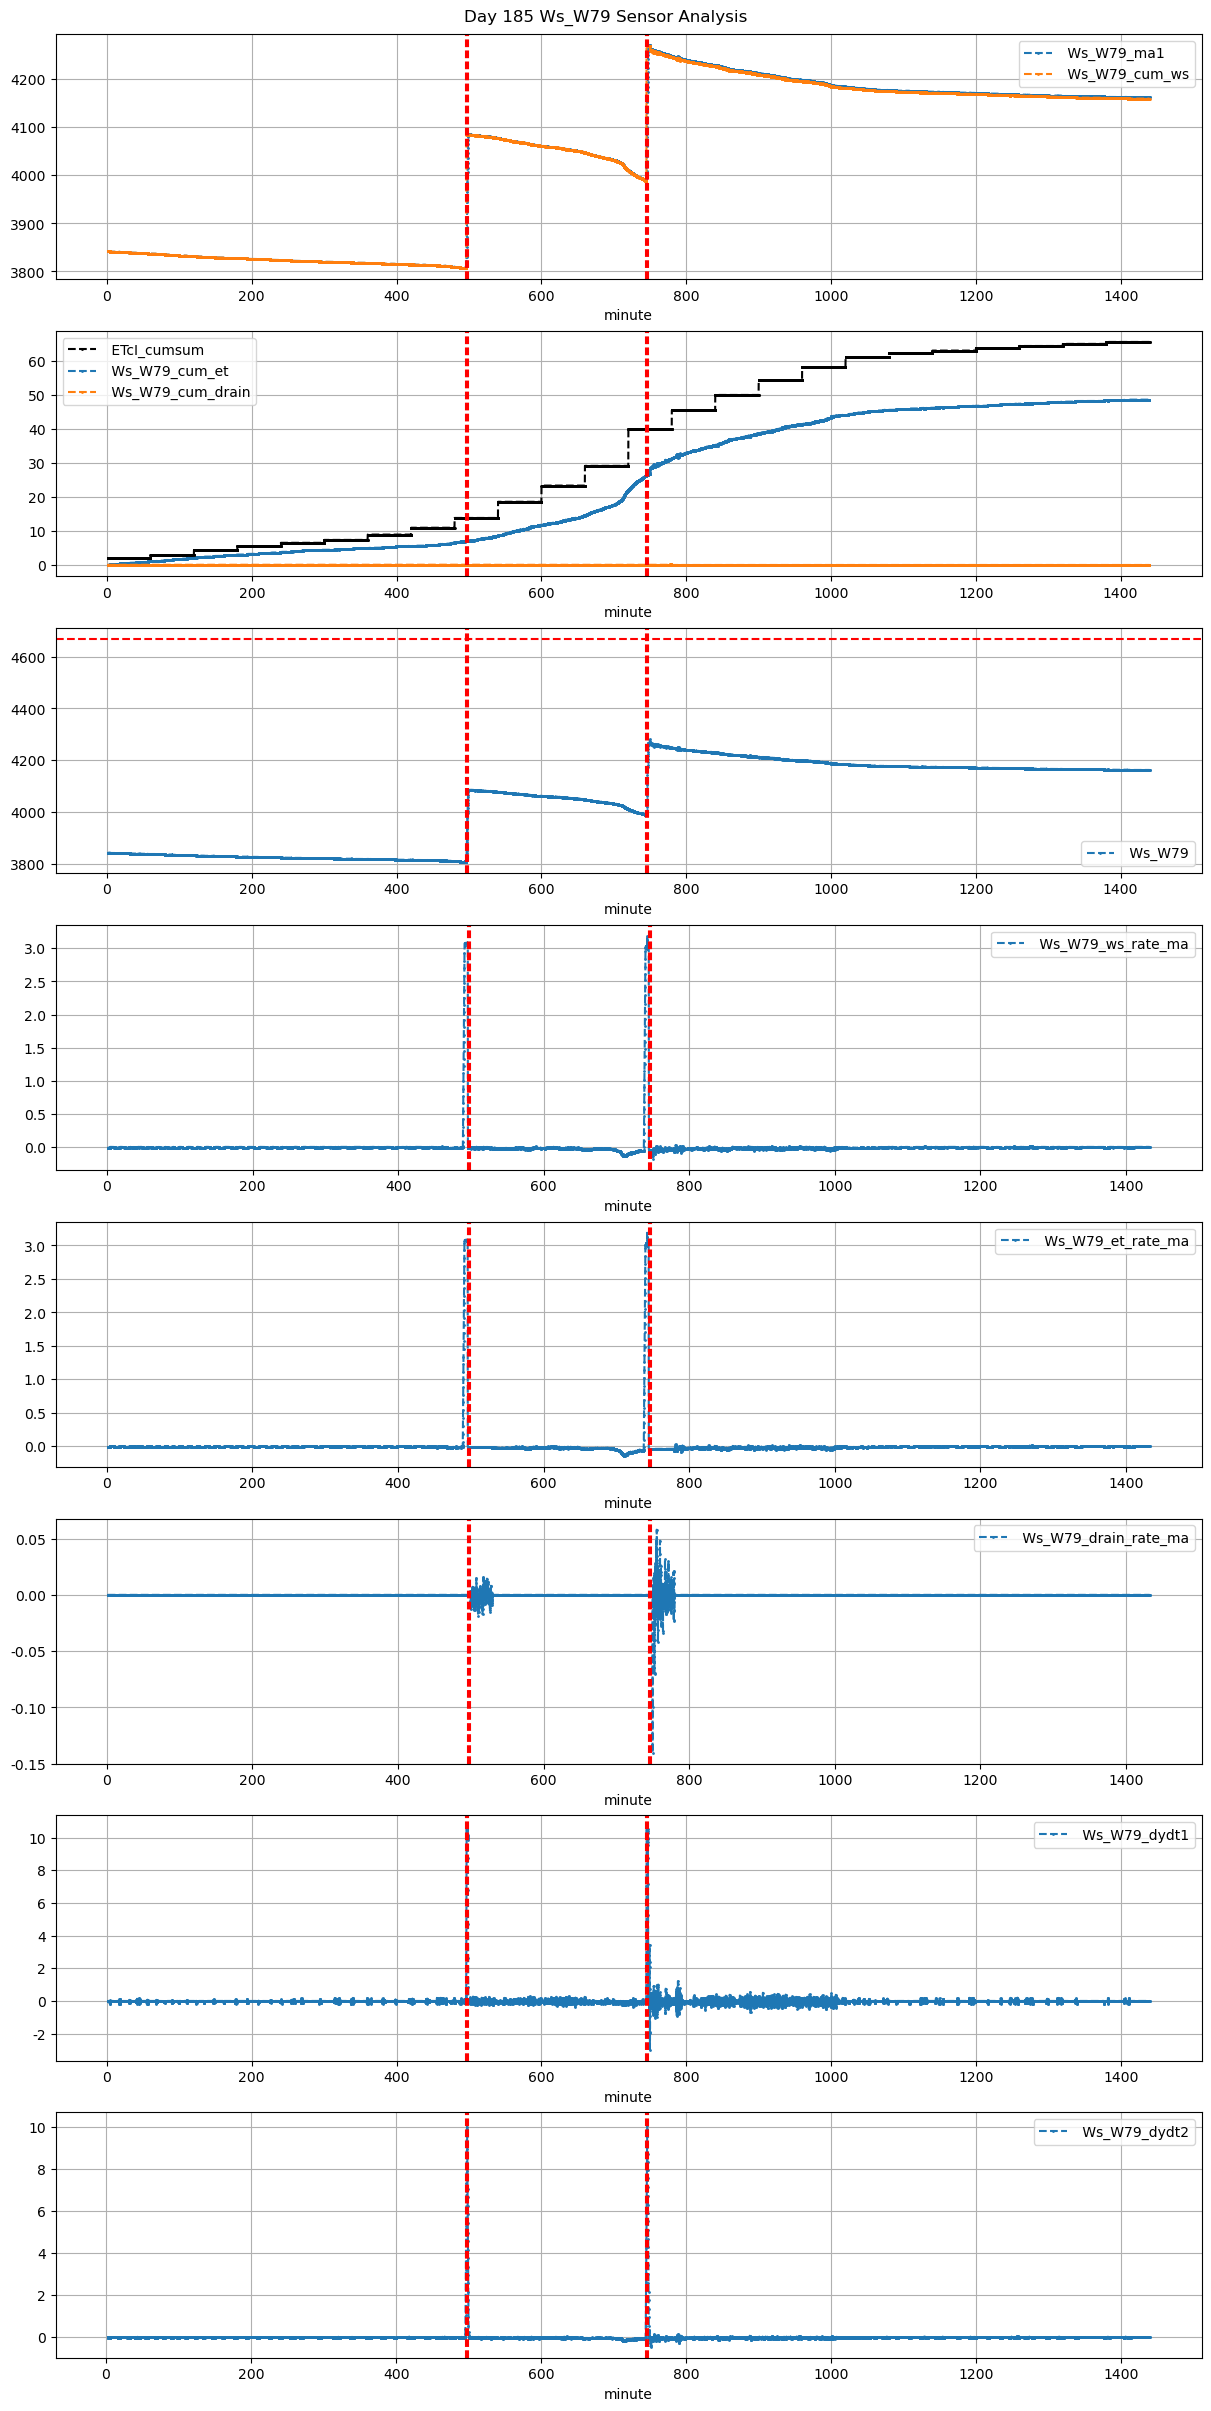
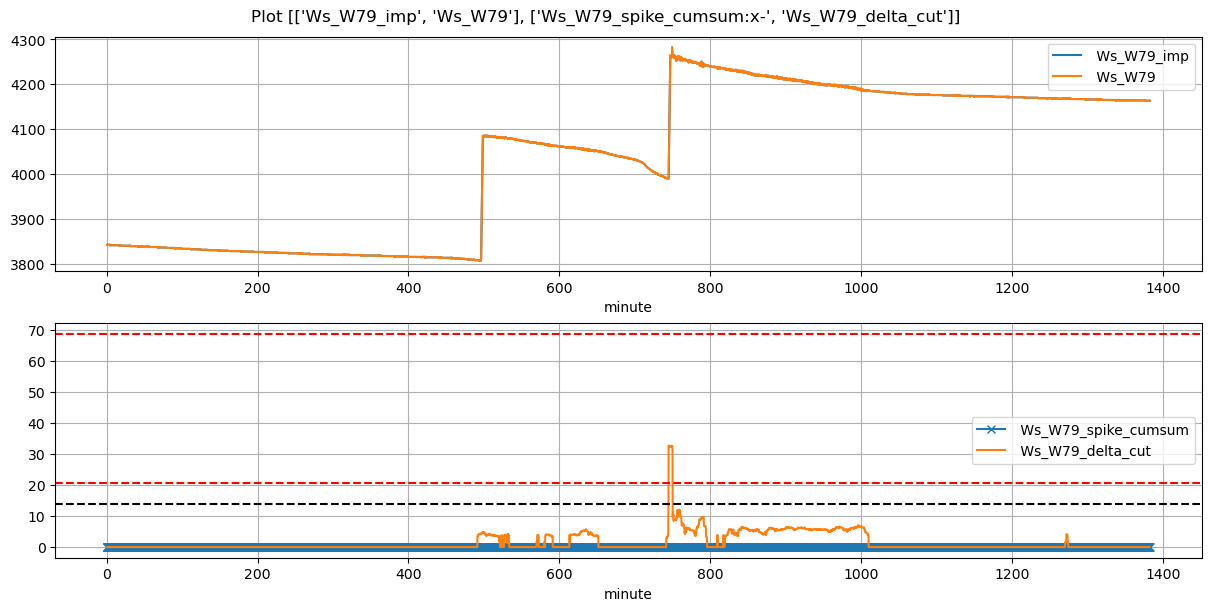
| 2026-04-09 08:16:24+08:00 | 185 | 496 | Ws_W79 | 0.129708 | 30 | 496.4 | 495.750000 | 498.58 | 499.000000 | 3807.500000 | 4085.000000 | 131 | -0.009040 | -0.011881 | -0.015162 | 0.35906 | 0.423664 | 55.50 | True | -39.0 | 25.2 | 55.50 | 0.0 | 0 | 0.0 | 20 | 780 | -0.232681 | NaN |
| 2026-04-09 12:25:00+08:00 | 185 | 745 | Ws_W79 | 0.129708 | 30 | 745.0 | 744.416667 | 747.18 | 749.583333 | 3989.533333 | 4282.333333 | 131 | -0.063885 | -0.061928 | -0.036065 | 0.31892 | 0.447023 | 58.56 | True | -35.0 | 144.2 | 58.56 | 0.0 | 0 | 0.0 | 50 | 154 | -1.851814 | NaN |