| 2026-04-08 07:28:54+08:00 |
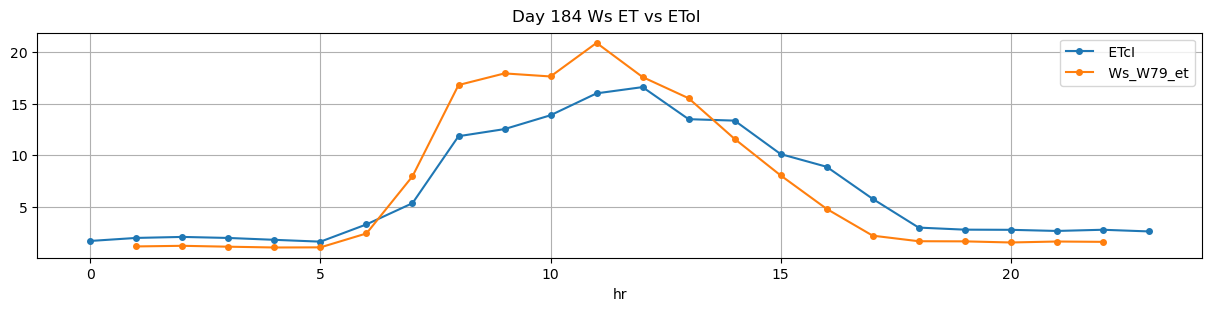
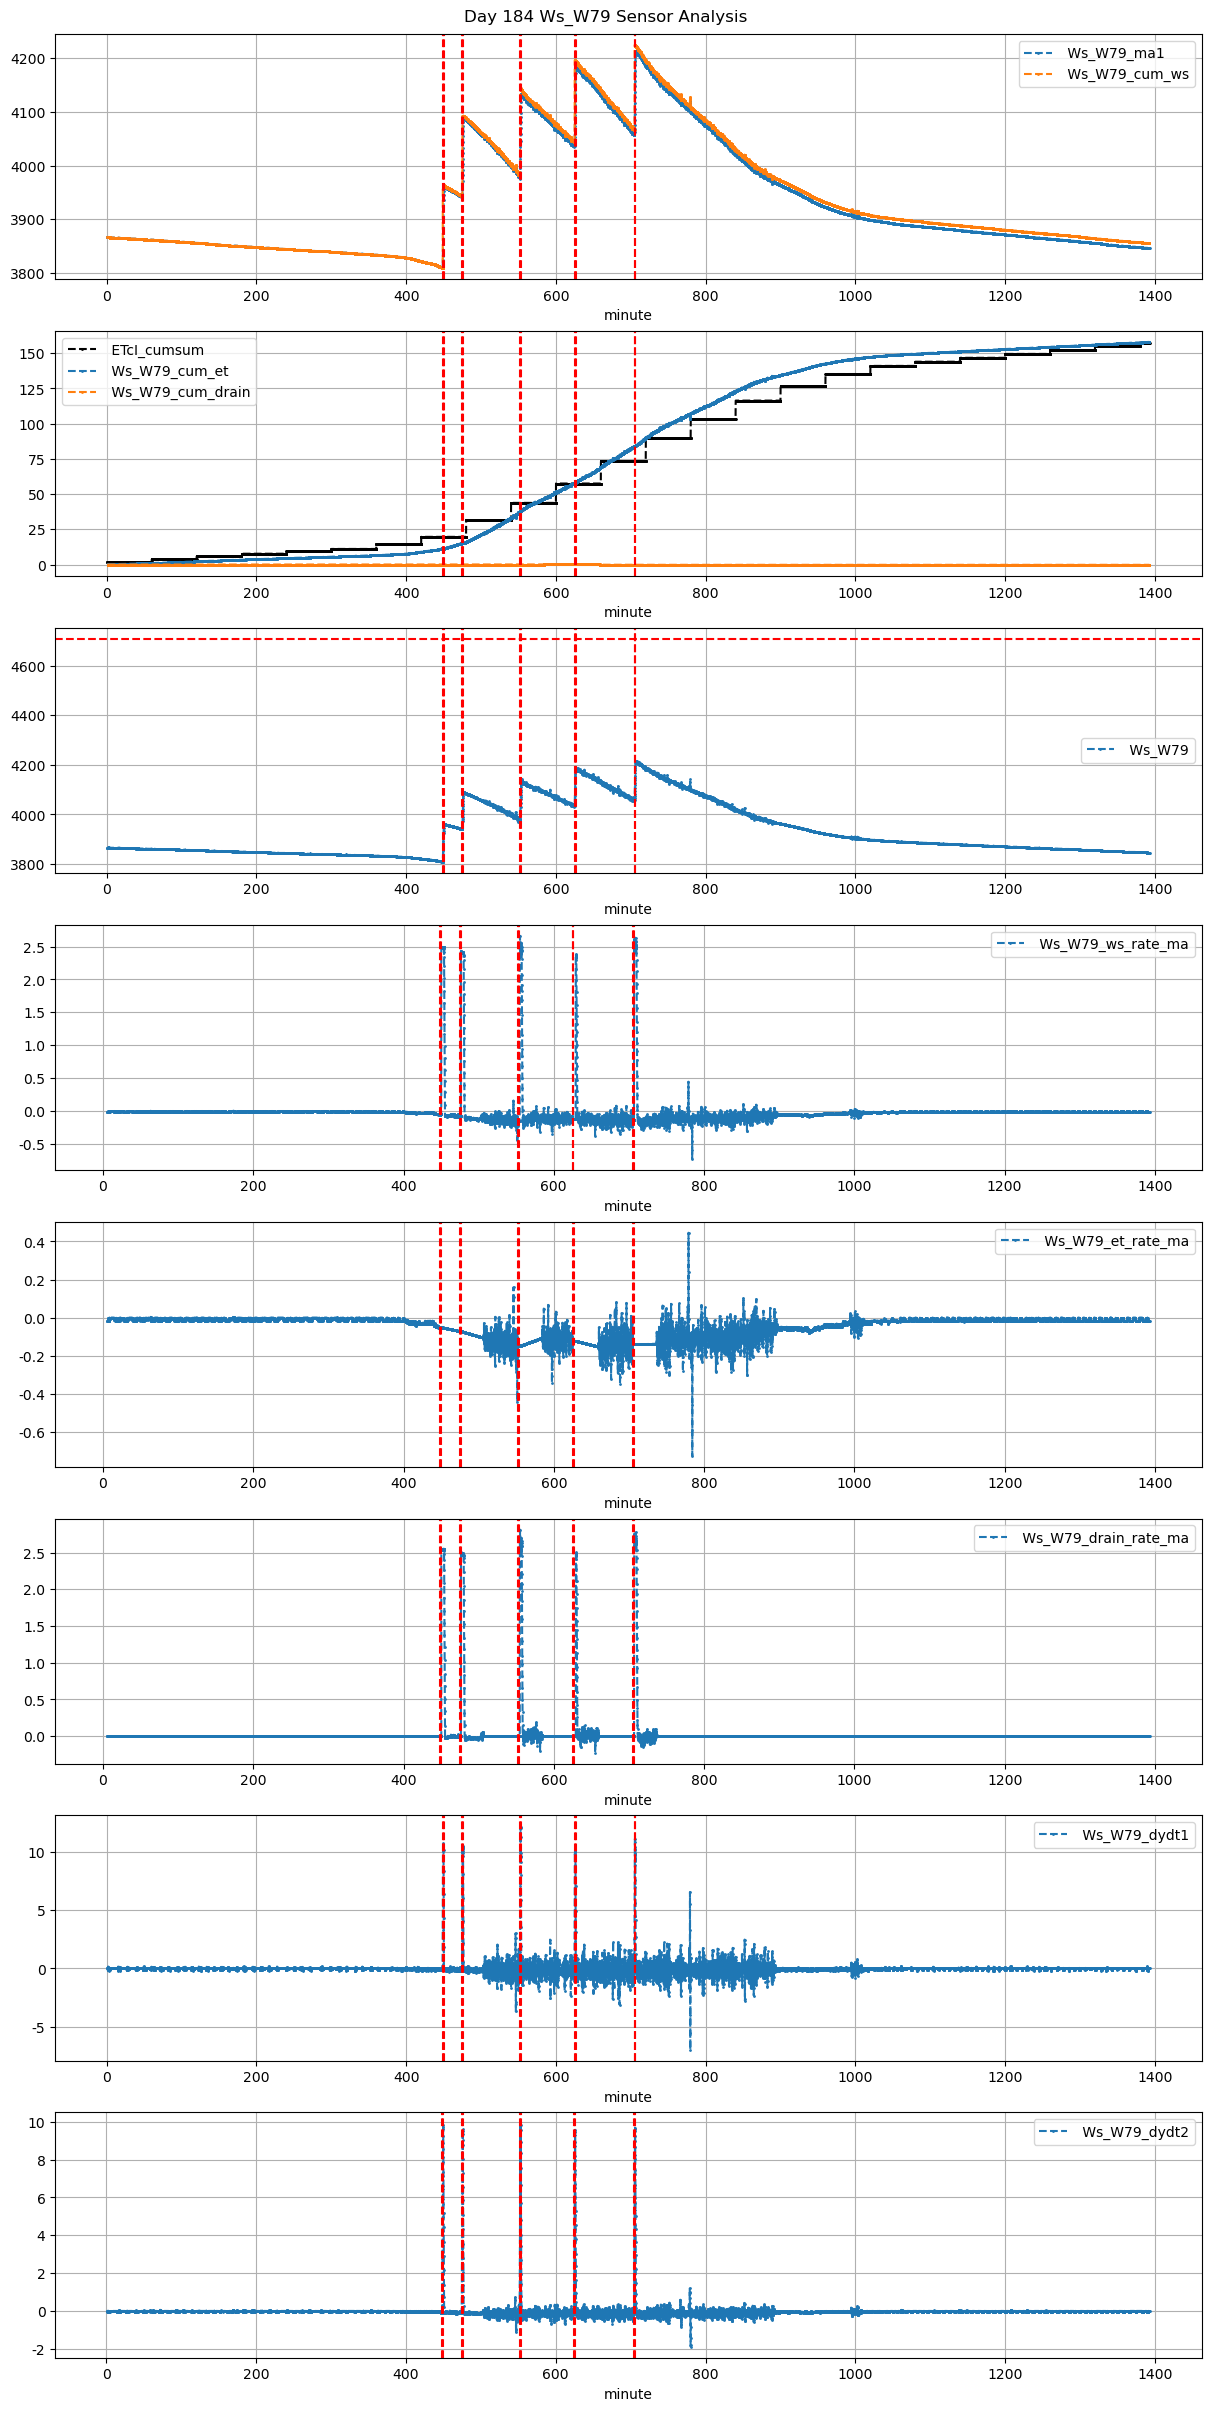
184 |
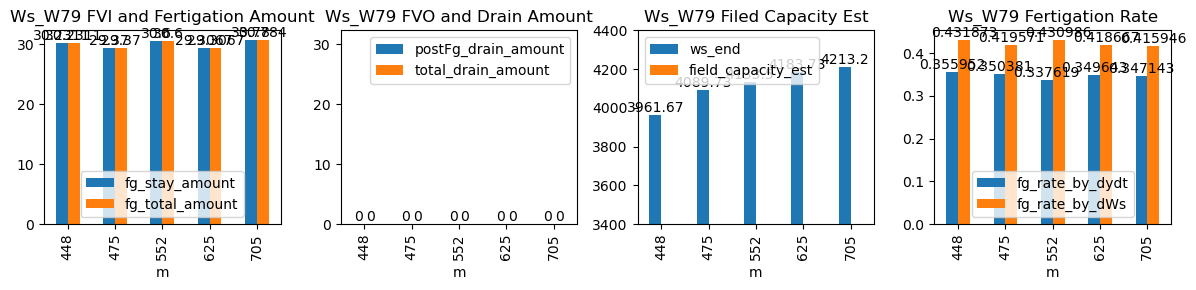
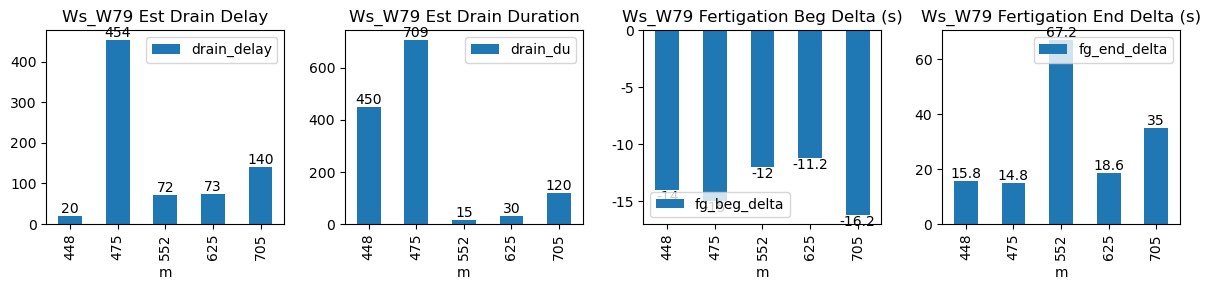
448 |
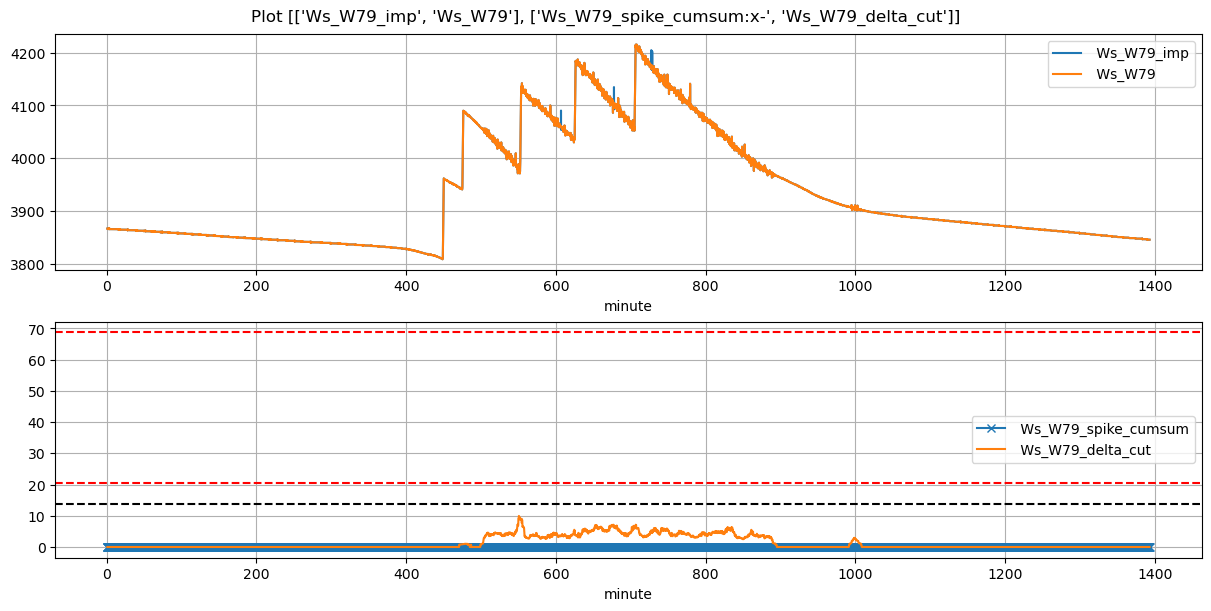
Ws_W79 |
0.462763 |
24.833333 |
448.90 |
448.666667 |
450.07 |
450.166667 |
3810.00 |
3962.0 |
70 |
-0.050659 |
-0.067847 |
0.000000 |
0.361976 |
0.434286 |
30.400 |
True |
-14.0 |
5.8 |
30.400 |
0.0 |
0 |
0.0 |
24 |
215 |
-0.146294 |
NaN |
| 2026-04-08 07:55:00+08:00 |
184 |
475 |
Ws_W79 |
0.462763 |
30.000000 |
475.00 |
474.750000 |
476.17 |
476.250000 |
3942.44 |
4090.0 |
70 |
-0.071551 |
-0.104722 |
-0.106111 |
0.355086 |
0.421600 |
29.512 |
True |
-15.0 |
4.8 |
29.512 |
0.0 |
0 |
0.0 |
19 |
349 |
-0.296103 |
NaN |
| 2026-04-08 09:12:12+08:00 |
184 |
552 |
Ws_W79 |
0.462763 |
30.000000 |
552.20 |
552.000000 |
553.38 |
554.583333 |
3979.00 |
4142.0 |
71 |
-0.160805 |
-0.149097 |
-0.106088 |
0.336810 |
0.459155 |
32.600 |
True |
-12.0 |
72.2 |
32.600 |
0.0 |
0 |
0.0 |
24 |
112 |
-0.969605 |
NaN |
| 2026-04-08 10:25:01+08:00 |
184 |
625 |
Ws_W79 |
0.462763 |
30.000000 |
625.02 |
624.833333 |
626.19 |
629.083333 |
4036.50 |
4187.0 |
70 |
-0.122622 |
-0.128264 |
-0.152560 |
0.255524 |
0.430000 |
30.100 |
True |
-11.2 |
173.6 |
30.100 |
0.0 |
0 |
0.0 |
9 |
183 |
-1.218720 |
NaN |
| 2026-04-08 11:45:01+08:00 |
184 |
705 |
Ws_W79 |
0.462763 |
30.000000 |
705.02 |
704.750000 |
706.25 |
706.666667 |
4058.60 |
4215.0 |
74 |
-0.141172 |
-0.169421 |
-0.137546 |
0.351762 |
0.422703 |
31.280 |
True |
-16.2 |
25.0 |
31.280 |
0.0 |
0 |
0.0 |
19 |
320 |
-0.963088 |
NaN |