| 2026-04-07 08:00:00+08:00 |
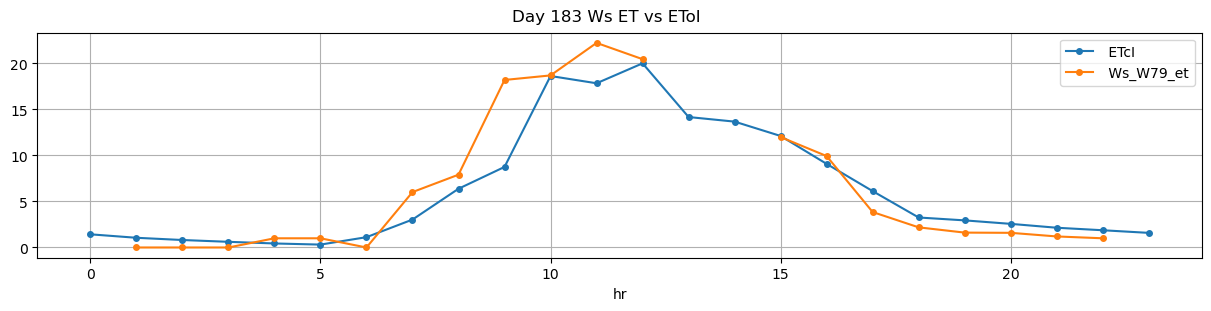
183 |
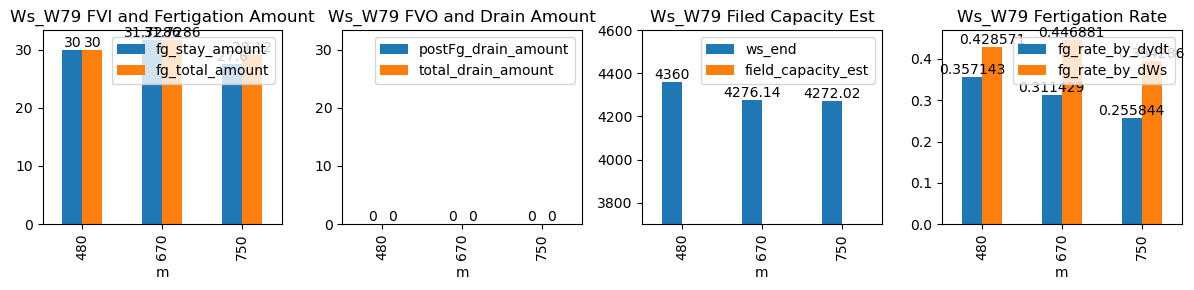
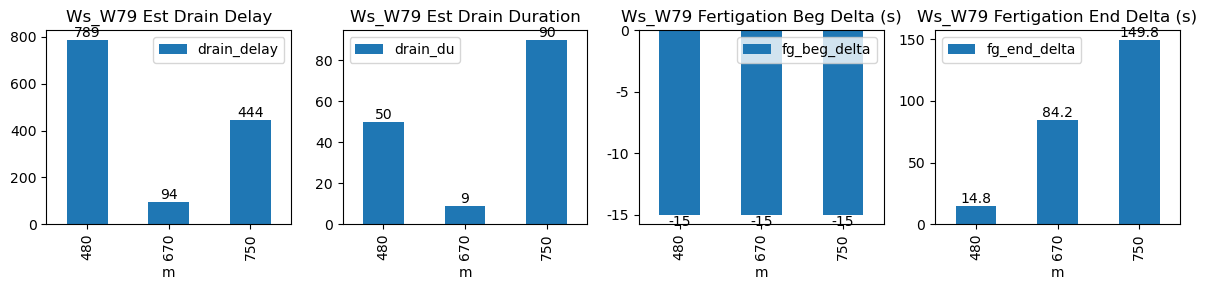
480 |
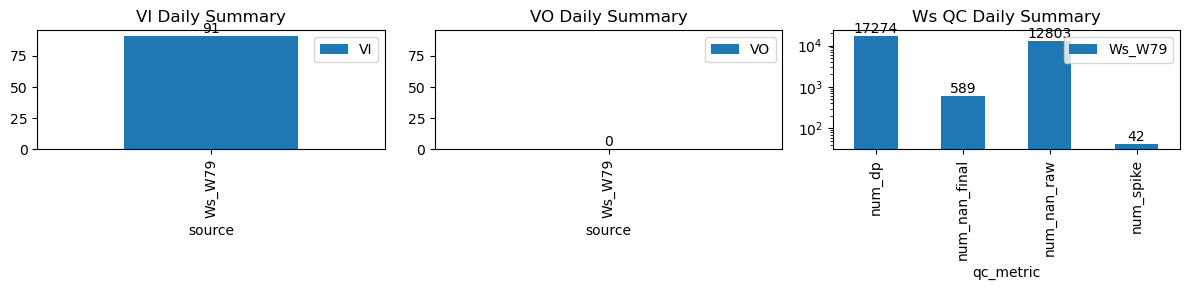
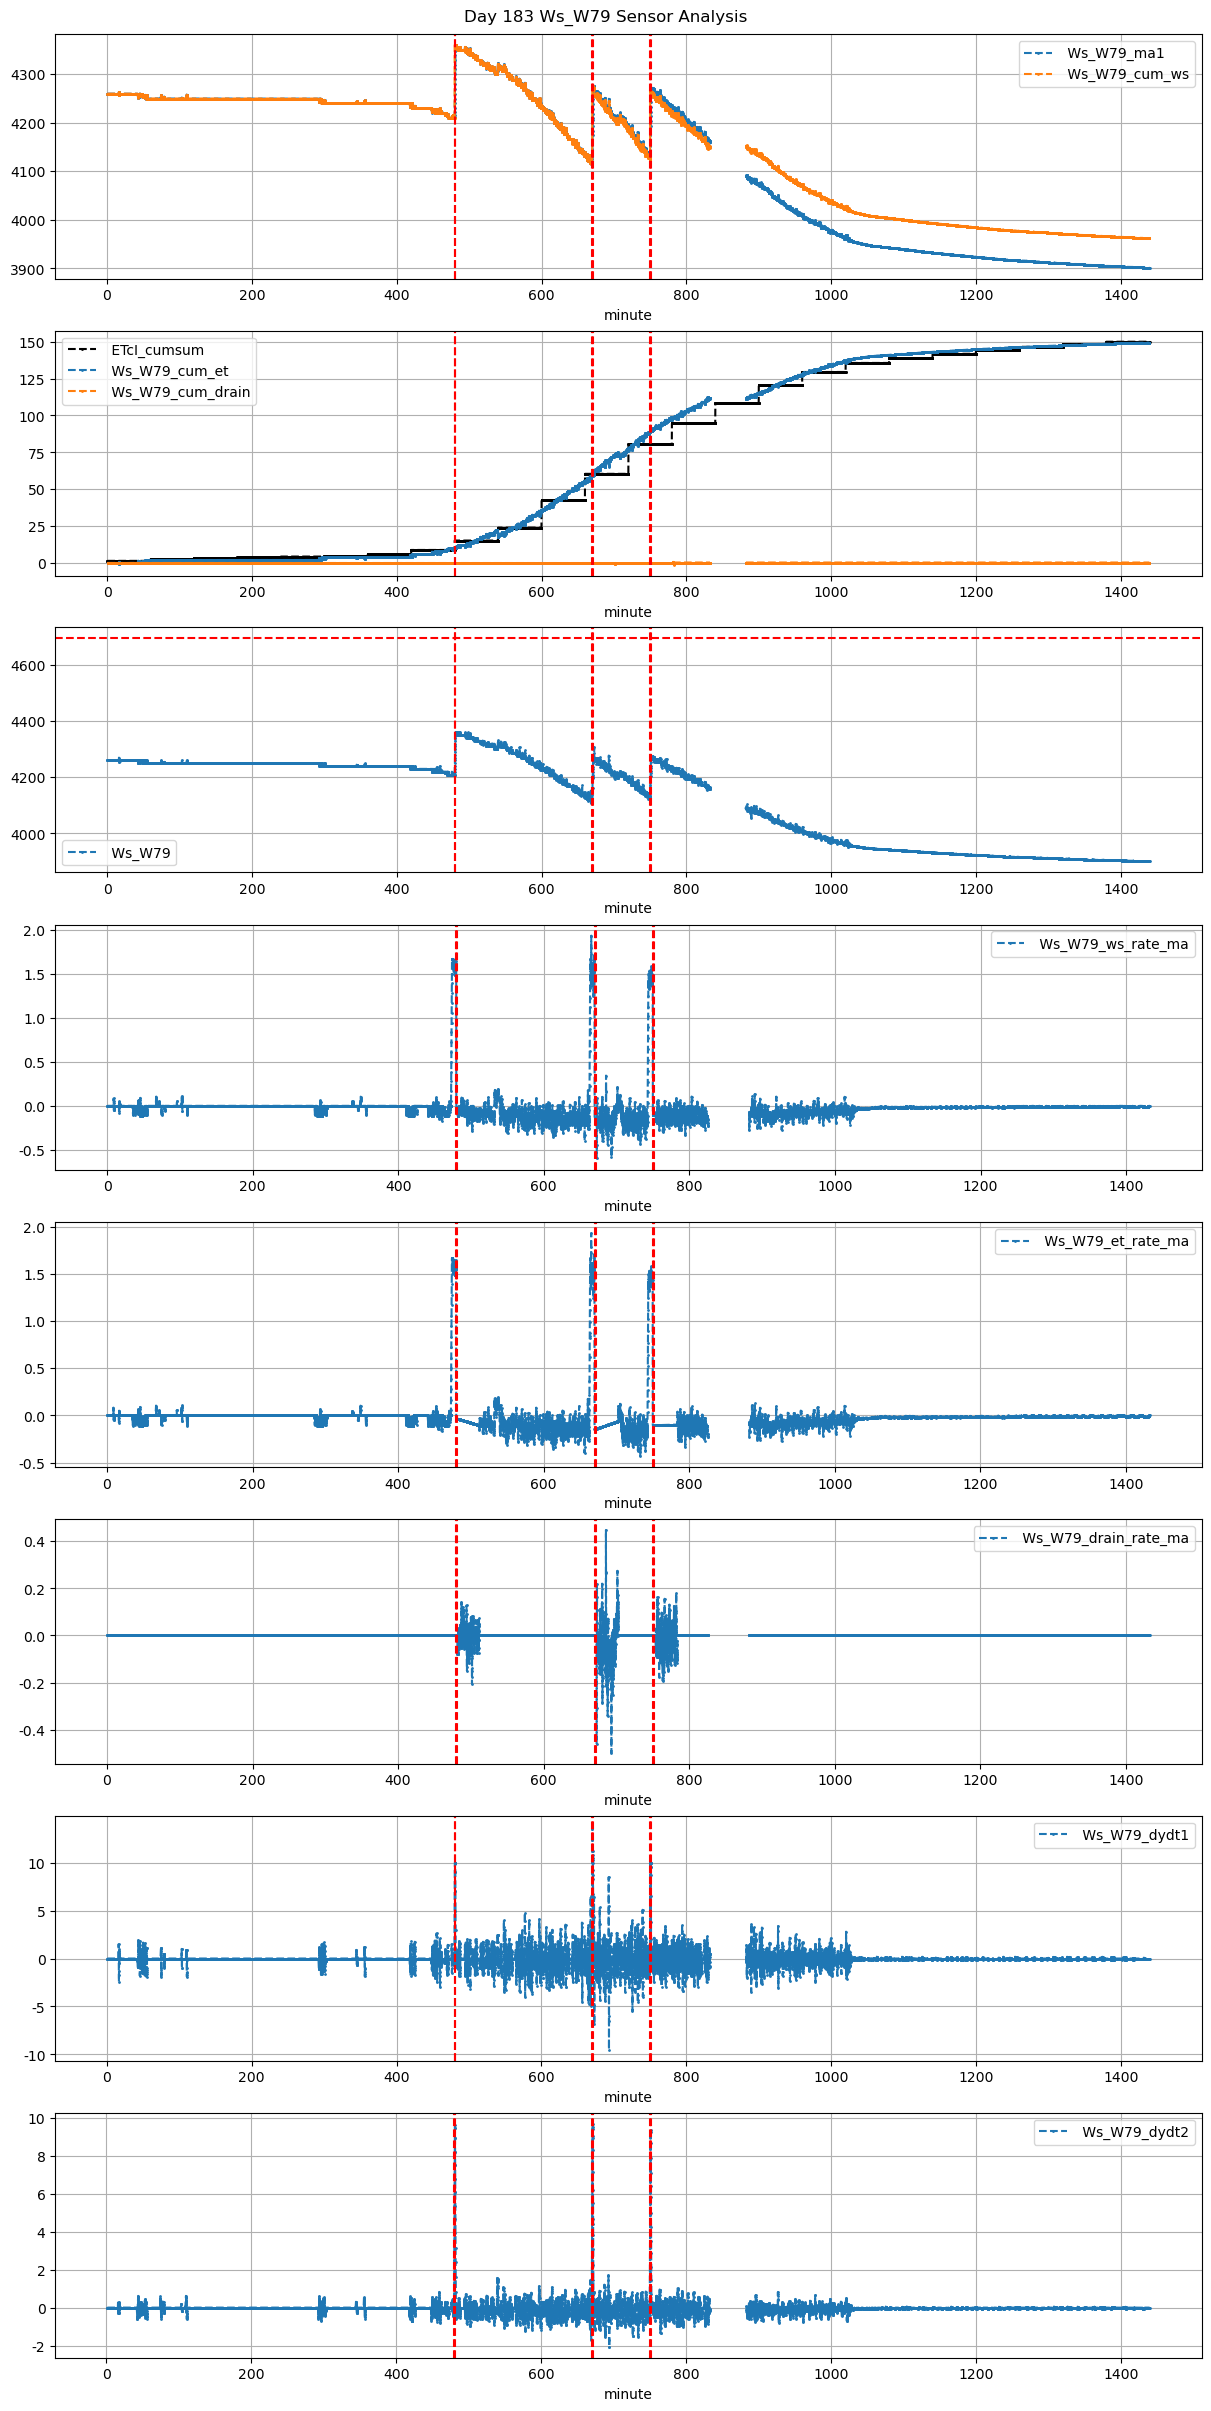
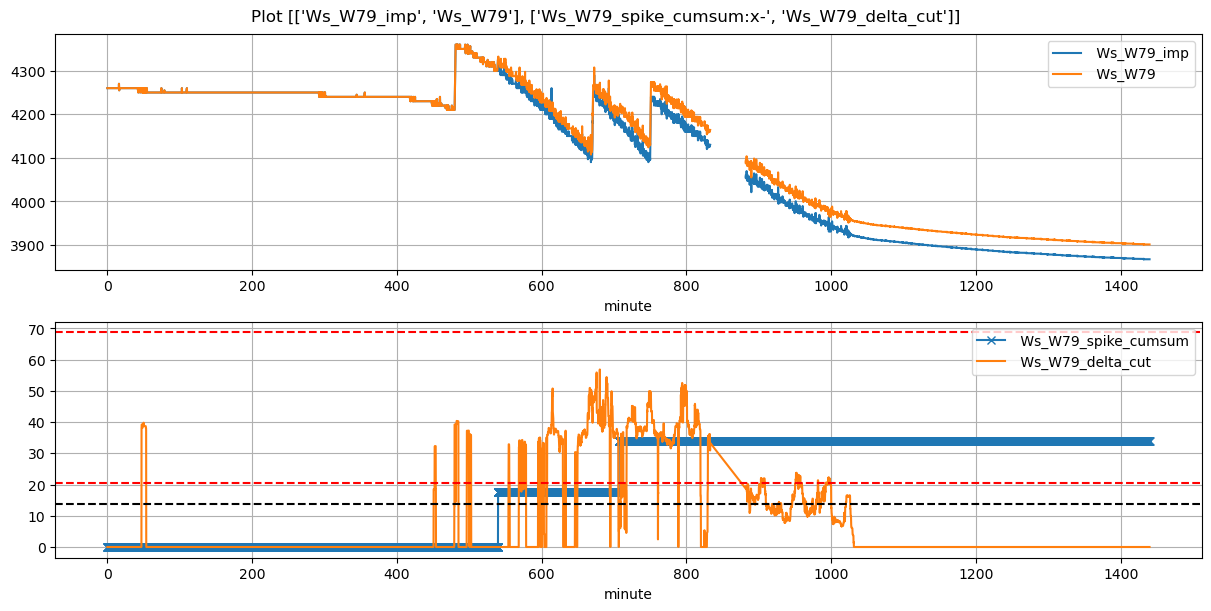
Ws_W79 |
0.910041 |
30 |
480.0 |
479.75 |
481.17 |
481.416667 |
4210.00000 |
4360.000000 |
70 |
-0.061382 |
-0.033162 |
-0.104012 |
0.357143 |
0.428571 |
30.000000 |
True |
-15.0 |
14.8 |
30.000000 |
0.0 |
0 |
0.0 |
50 |
789 |
-0.102875 |
NaN |
| 2026-04-07 11:10:00+08:00 |
183 |
670 |
Ws_W79 |
0.910041 |
30 |
670.0 |
669.75 |
671.18 |
672.583333 |
4117.50000 |
4276.142857 |
71 |
-0.138247 |
-0.164575 |
-0.059859 |
0.311429 |
0.446881 |
31.728571 |
True |
-15.0 |
84.2 |
31.728571 |
0.0 |
0 |
0.0 |
9 |
94 |
-0.224308 |
NaN |
| 2026-04-07 12:30:00+08:00 |
183 |
750 |
Ws_W79 |
0.910041 |
30 |
750.0 |
749.75 |
751.17 |
753.666667 |
4134.02381 |
4272.023810 |
70 |
-0.148312 |
-0.102778 |
-0.096405 |
0.255844 |
0.394286 |
27.600000 |
True |
-15.0 |
149.8 |
29.120000 |
0.0 |
0 |
0.0 |
90 |
444 |
-0.148380 |
NaN |