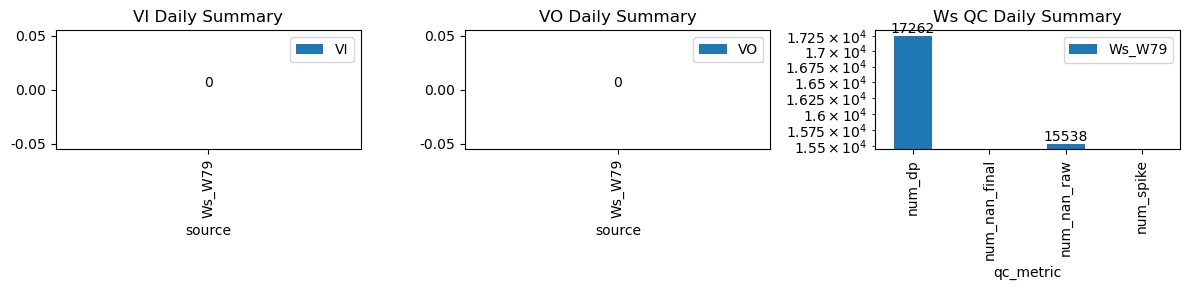
VI and VO Daily Summary

| ws_name | num_dp | num_nan_raw | num_nan_final | num_spike | cum_step_adj |
|---|---|---|---|---|---|
| Ws_W79 | 16,975 | 15,280 | 0 | 0 | 0.00 |
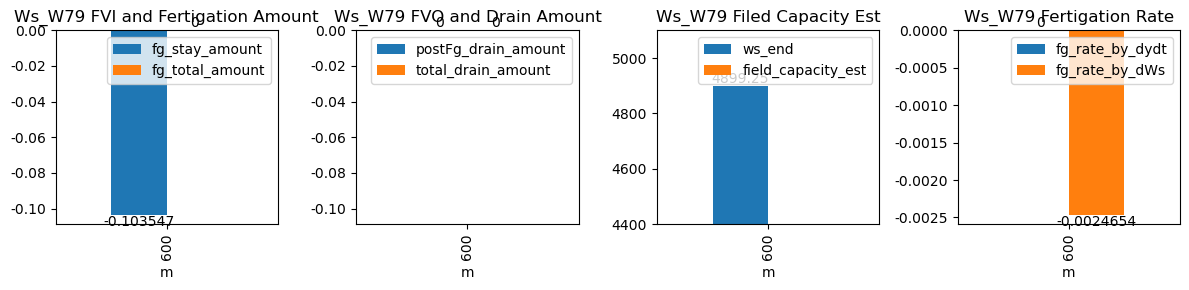
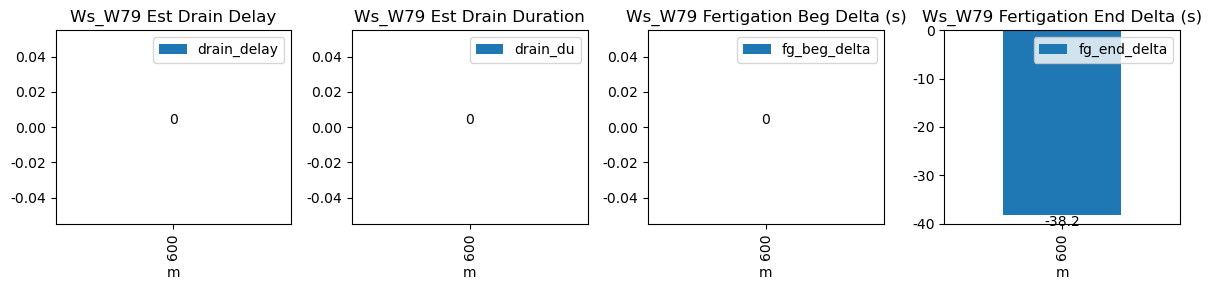
| ds | d | m | ws_name | prominence_cut | max_drain_du | fg_beg | fg_beg_est | fg_end | fg_end_est | ws_beg | ws_end | duc | pre_fg_et | post_fg_ws | post_drn_et | fg_rate_by_dydt | fg_rate_by_dWs | fg_stay_amount | enough_data | fg_beg_delta | fg_end_delta | fg_total_amount | fg_drain_amount | postFg_drain_amount | total_drain_amount | drain_du | drain_delay | drain_rate | field_capacity_est |
|---|---|---|---|---|---|---|---|---|---|---|---|---|---|---|---|---|---|---|---|---|---|---|---|---|---|---|---|---|---|
| 2026-04-06 10:00:01+08:00 | 182 | 600 | Ws_W79 | 2.479836 | 30 | 600.02 | NaN | 600.72 | 600.083333 | 4900.0 | 4899.0 | 42 | -0.000139 | -0.474167 | -0.000139 | NaN | -0.000003 | -0.000139 | False | NaN | -38.2 | NaN | NaN | NaN | NaN | NaN | NaN | NaN | NaN |