VI and VO Daily Summary
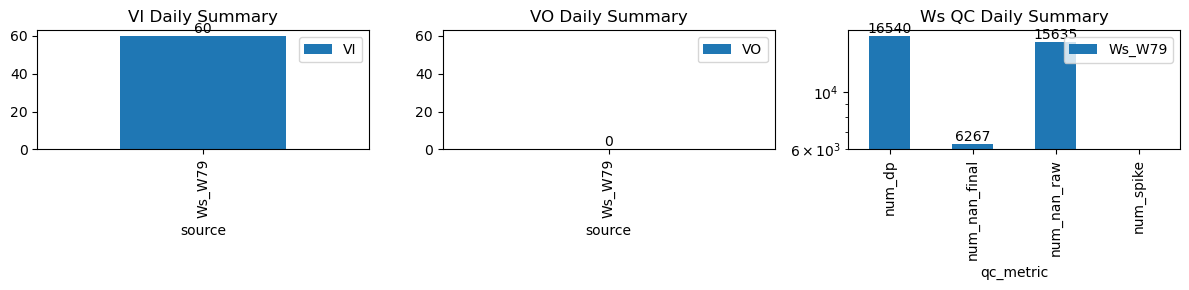
| ws_name | num_dp | num_nan_raw | num_nan_final | num_spike | cum_step_adj |
|---|---|---|---|---|---|
| Ws_W79 | 16,540 | 15,635 | 6,267 | 0 | 0.00 |
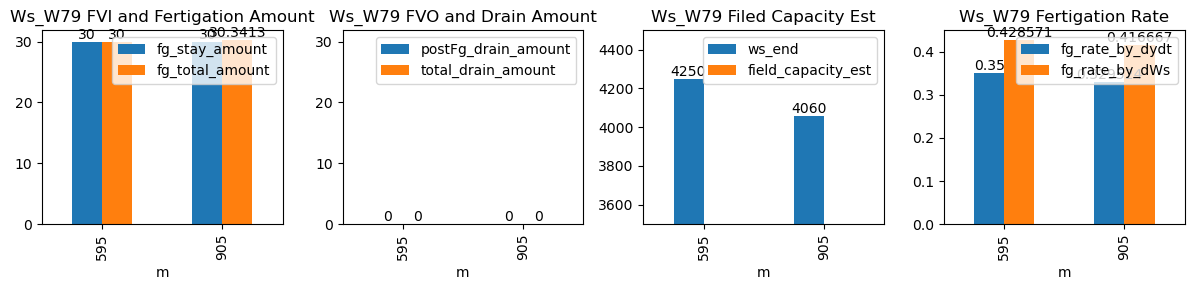
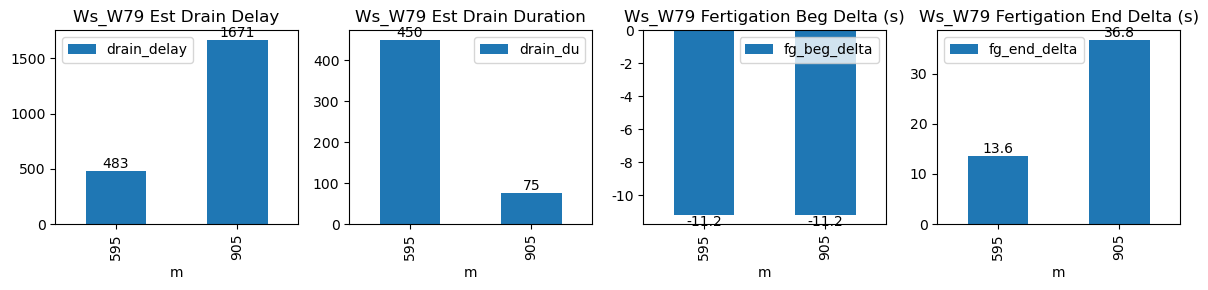
| ds | d | m | ws_name | prominence_cut | max_drain_du | fg_beg | fg_beg_est | fg_end | fg_end_est | ws_beg | ws_end | duc | pre_fg_et | post_fg_ws | post_drn_et | fg_rate_by_dydt | fg_rate_by_dWs | fg_stay_amount | enough_data | fg_beg_delta | fg_end_delta | fg_total_amount | fg_drain_amount | postFg_drain_amount | total_drain_amount | drain_du | drain_delay | drain_rate | field_capacity_est |
|---|---|---|---|---|---|---|---|---|---|---|---|---|---|---|---|---|---|---|---|---|---|---|---|---|---|---|---|---|---|
| 2026-03-25 09:55:01+08:00 | 170 | 595 | Ws_W79 | 1.315031 | 30 | 595.02 | 594.833333 | 596.19 | 596.416667 | 4100.0 | 4250.0 | 70 | 0.000000 | -0.000794 | 0.000000 | 0.350000 | 0.428571 | 30.0 | True | -11.2 | 13.6 | 30.00000 | 0.0 | 0 | 0.0 | 450 | 483 | -0.111111 | NaN |
| 2026-03-25 15:05:01+08:00 | 170 | 905 | Ws_W79 | 1.315031 | 30 | 905.02 | 904.833333 | 906.22 | 906.833333 | 3910.0 | 4060.0 | 72 | -0.102283 | -0.103704 | -0.094033 | 0.329524 | 0.416667 | 30.0 | True | -11.2 | 36.8 | 30.34134 | 0.0 | 0 | 0.0 | 75 | 1671 | -0.016327 | NaN |