| 2026-02-25 11:37:06+08:00 |
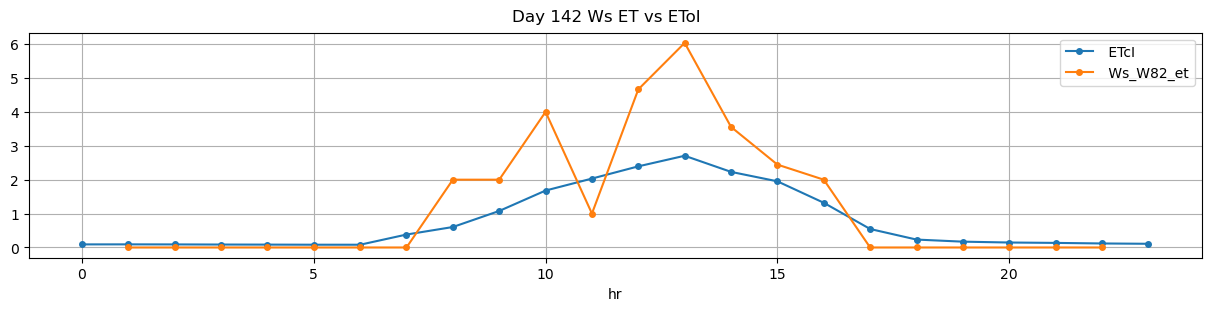
142 |
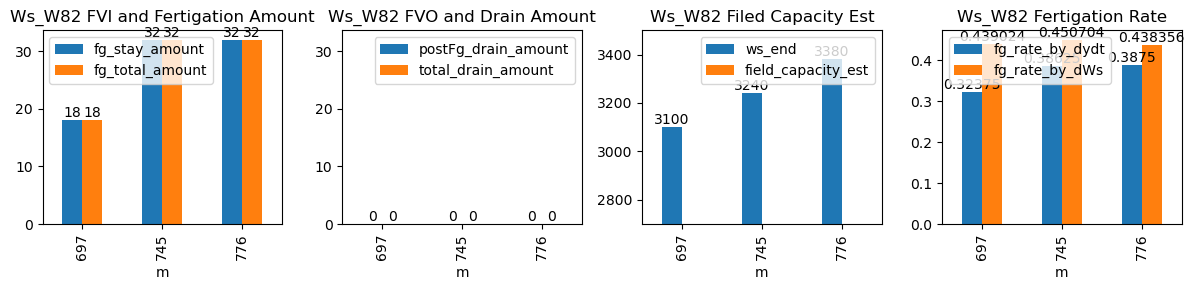
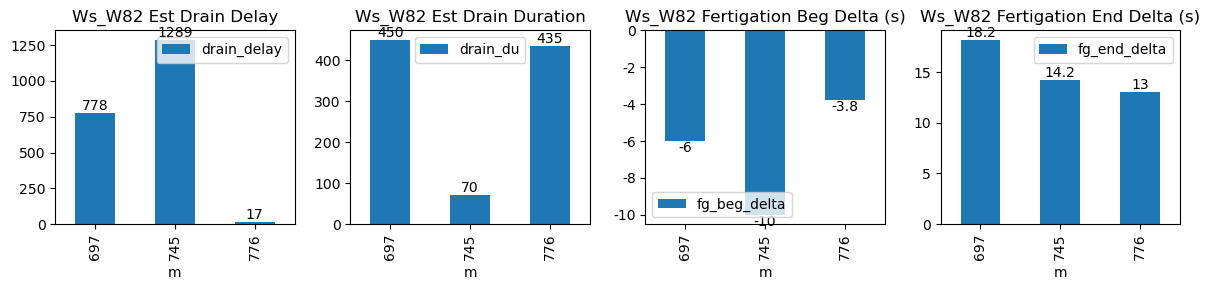
697 |
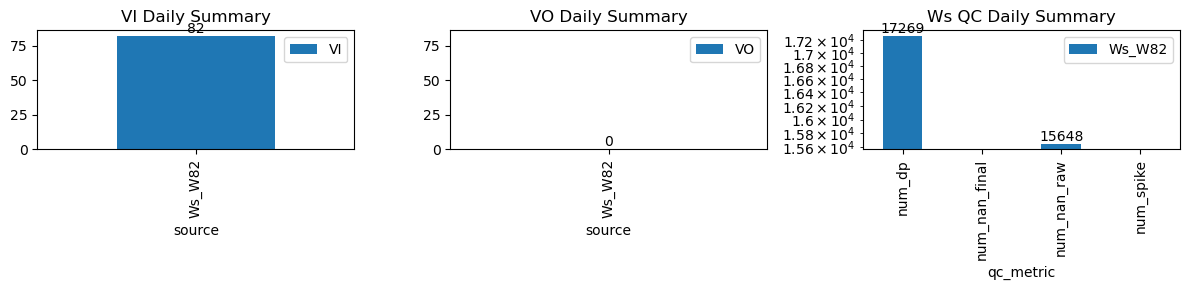
Ws_W82 |
1.791101 |
30.000000 |
697.10 |
697.000000 |
697.78 |
698.083333 |
3010.0 |
3100.0 |
41 |
-0.081357 |
0.000000 |
0.000000 |
0.32375 |
0.439024 |
18.0 |
True |
-6.0 |
18.2 |
18.0 |
0.0 |
0.0 |
0.0 |
450 |
778 |
-0.111111 |
NaN |
| 2026-02-25 12:25:00+08:00 |
142 |
745 |
Ws_W82 |
1.791101 |
29.583333 |
745.00 |
744.833333 |
746.18 |
746.416667 |
3080.0 |
3240.0 |
71 |
-0.085019 |
-0.070370 |
0.000000 |
0.38625 |
0.450704 |
32.0 |
True |
-10.0 |
14.2 |
32.0 |
0.0 |
0.0 |
0.0 |
70 |
1289 |
-0.091342 |
NaN |
| 2026-02-25 12:56:14+08:00 |
142 |
776 |
Ws_W82 |
1.791101 |
30.000000 |
776.23 |
776.166667 |
777.45 |
777.666667 |
3220.0 |
3380.0 |
73 |
-0.018790 |
-0.107407 |
-0.085802 |
0.38750 |
0.438356 |
32.0 |
True |
-3.8 |
13.0 |
32.0 |
0.0 |
0.0 |
0.0 |
435 |
17 |
-0.090595 |
NaN |