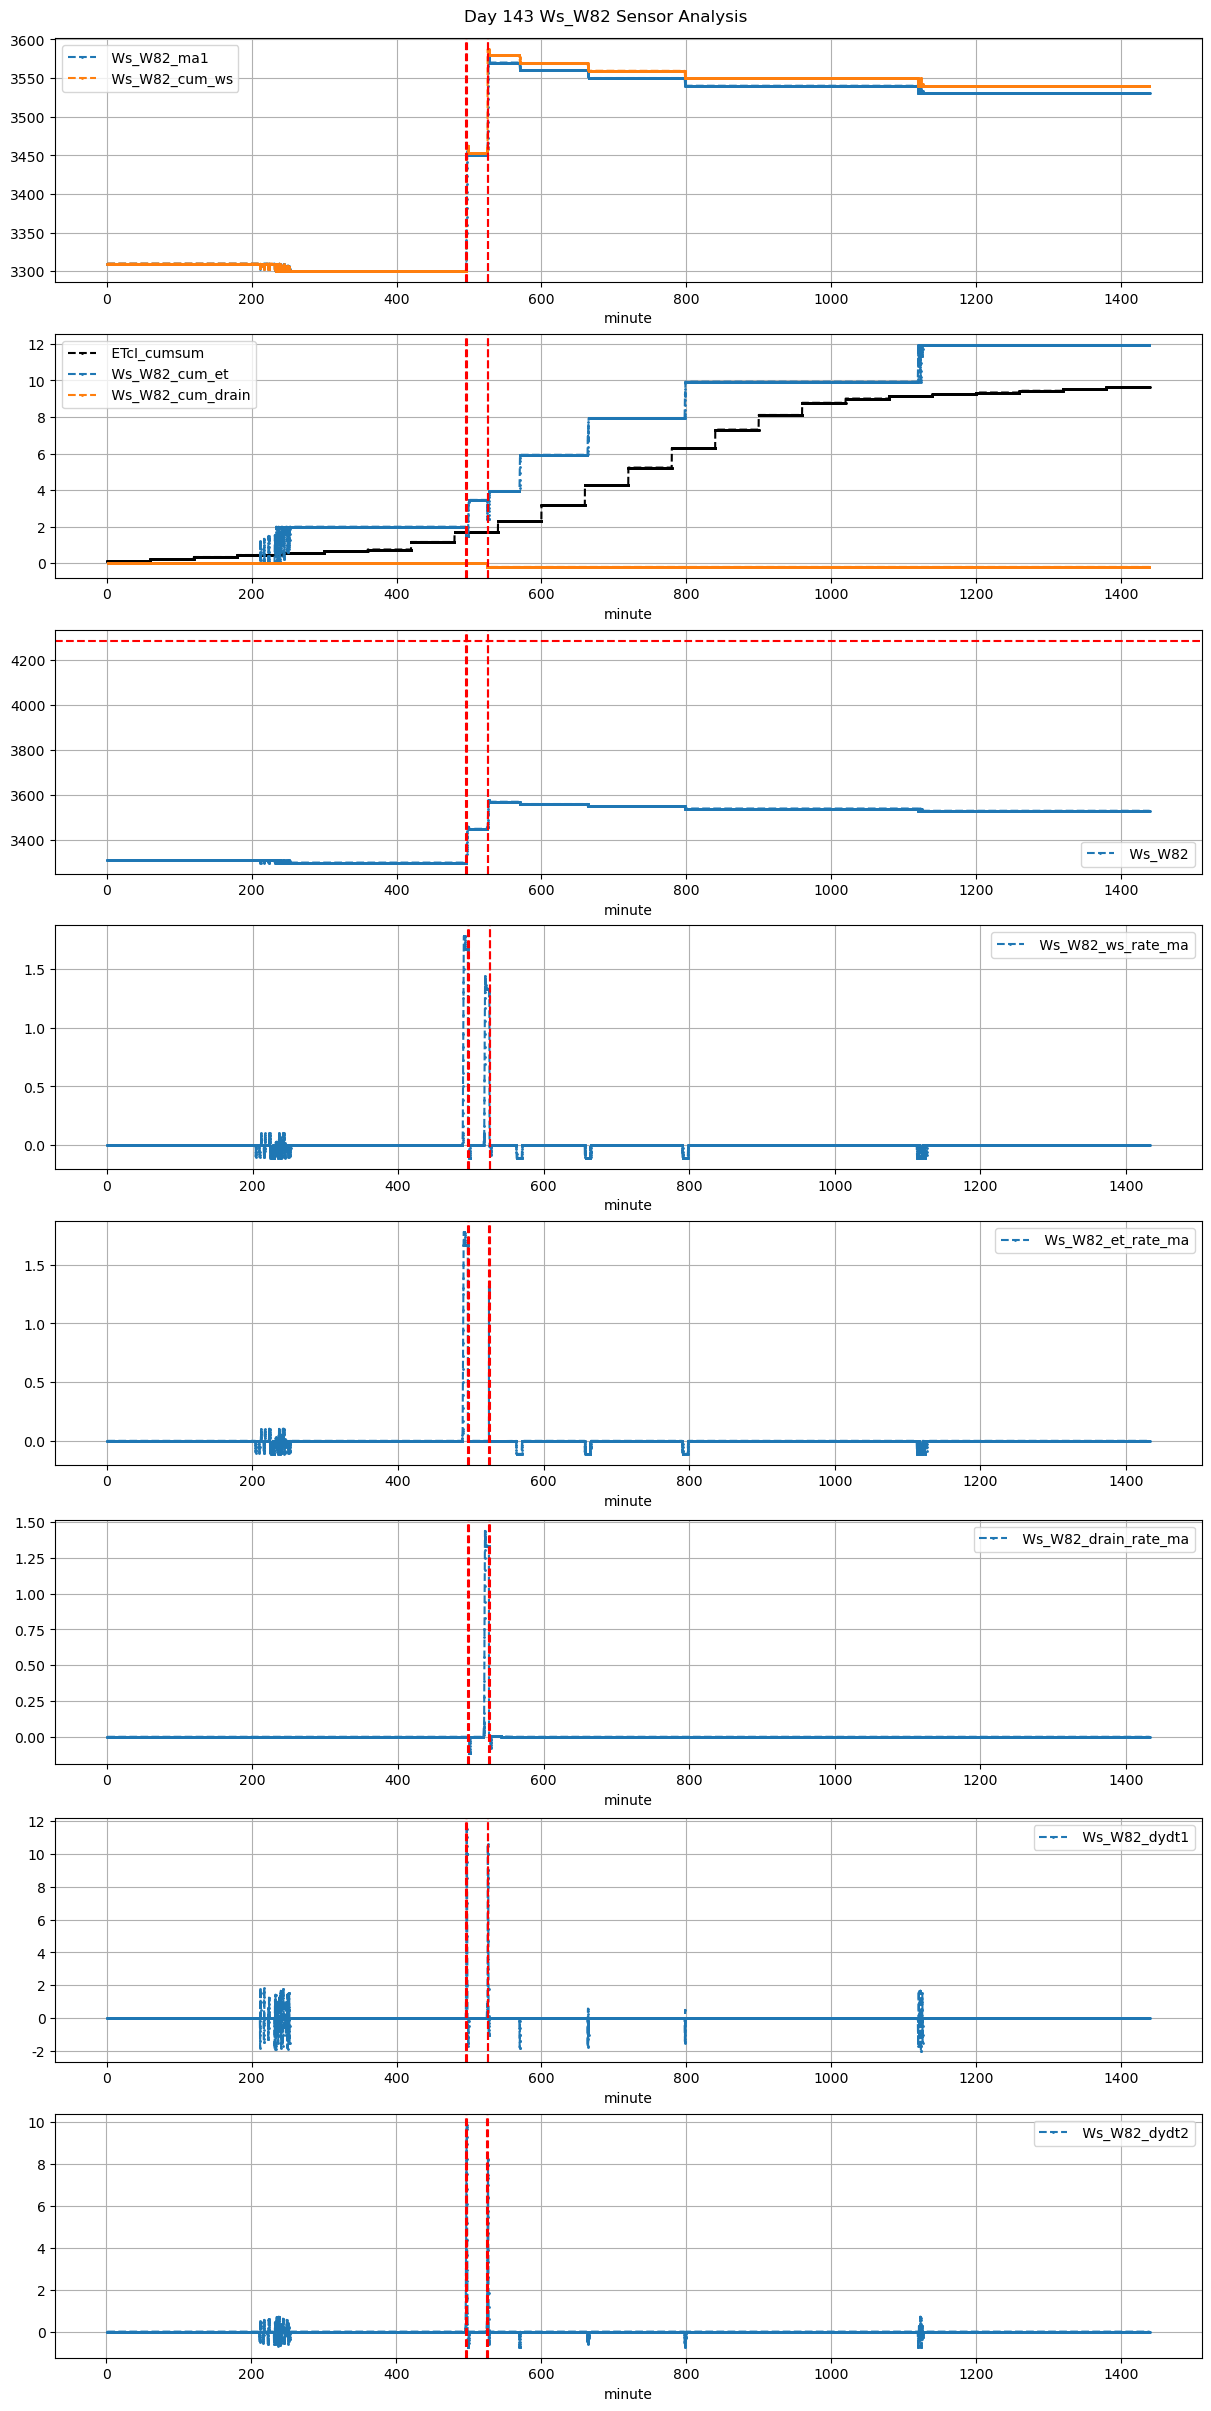
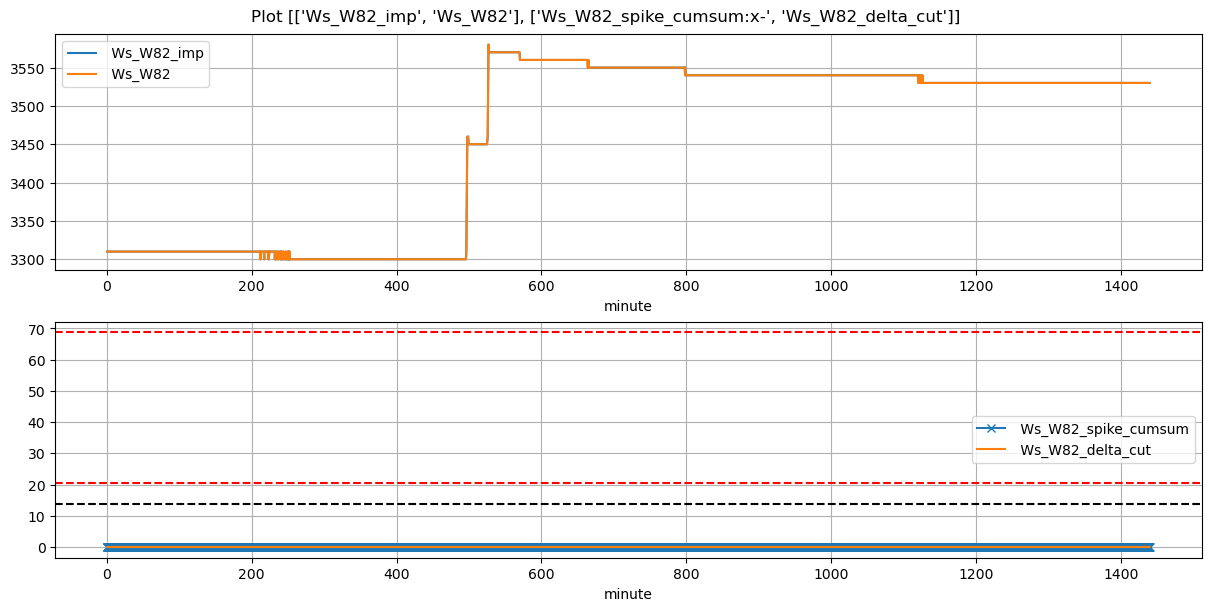
VI and VO Daily Summary
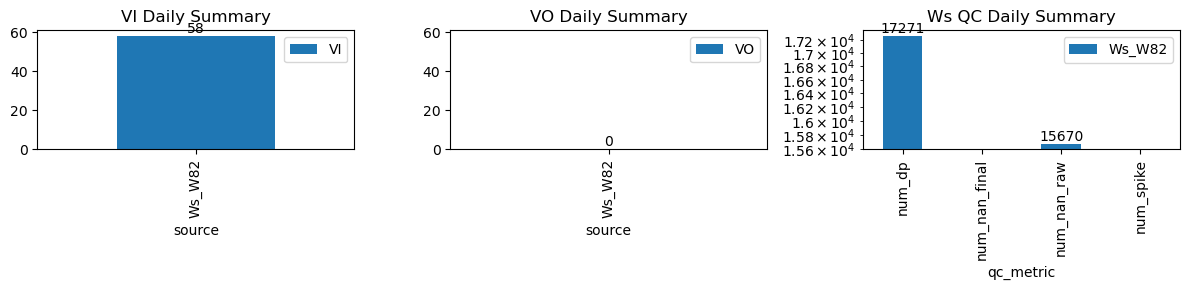
| ws_name | num_dp | num_nan_raw | num_nan_final | num_spike | cum_step_adj |
|---|---|---|---|---|---|
| Ws_W82 | 17,271 | 15,670 | 0 | 0 | 0.00 |
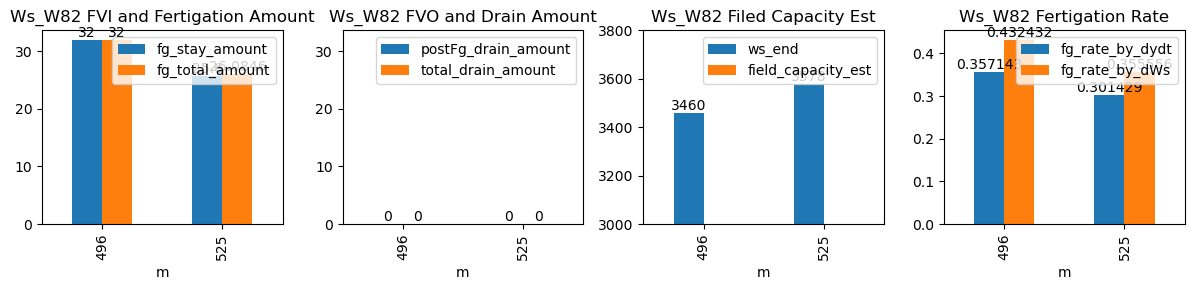
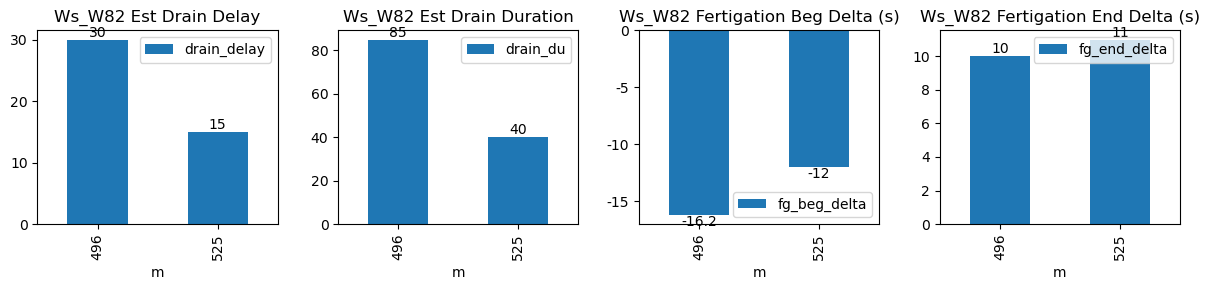
| ds | d | m | ws_name | prominence_cut | max_drain_du | fg_beg | fg_beg_est | fg_end | fg_end_est | ws_beg | ws_end | duc | pre_fg_et | post_fg_ws | post_drn_et | fg_rate_by_dydt | fg_rate_by_dWs | fg_stay_amount | enough_data | fg_beg_delta | fg_end_delta | fg_total_amount | fg_drain_amount | postFg_drain_amount | total_drain_amount | drain_du | drain_delay | drain_rate | field_capacity_est |
|---|---|---|---|---|---|---|---|---|---|---|---|---|---|---|---|---|---|---|---|---|---|---|---|---|---|---|---|---|---|
| 2026-02-26 08:16:16+08:00 | 143 | 496 | Ws_W82 | 1.137892 | 27.333333 | 496.27 | 496.0 | 497.5 | 497.666667 | 3300.0 | 3460.0 | 74 | 0.000000 | -0.022222 | 0.0 | 0.357143 | 0.432432 | 32.0 | True | -16.2 | 10.0 | 32.000000 | 0.0 | 0 | 0.0 | 85 | 30 | -0.111111 | NaN |
| 2026-02-26 08:45:42+08:00 | 143 | 525 | Ws_W82 | 1.137892 | 30.000000 | 525.70 | 525.5 | 526.9 | 527.083333 | 3450.0 | 3578.0 | 72 | -0.004208 | -0.005000 | 0.0 | 0.301429 | 0.355556 | 25.6 | True | -12.0 | 11.0 | 26.084565 | 0.0 | 0 | 0.0 | 40 | 15 | -0.075252 | NaN |