VI and VO Daily Summary
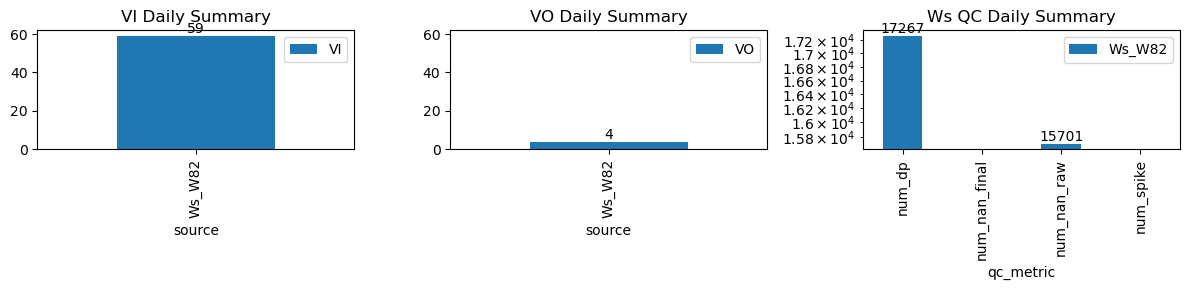
| ws_name | num_dp | num_nan_raw | num_nan_final | num_spike | cum_step_adj |
|---|---|---|---|---|---|
| Ws_W82 | 17,267 | 15,701 | 0 | 0 | 0.00 |
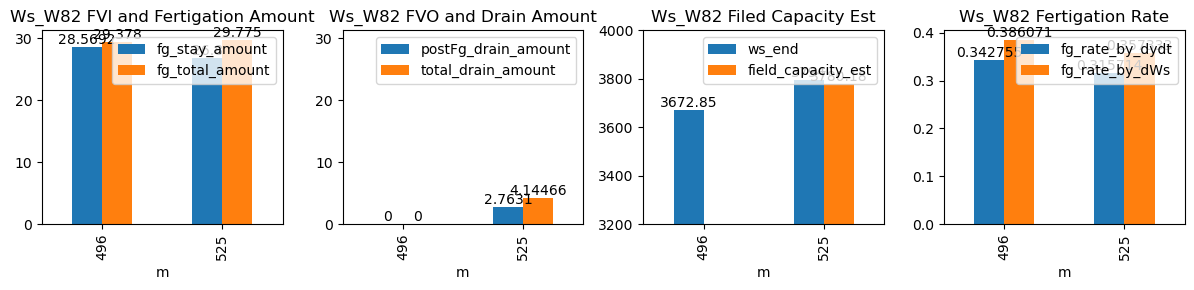
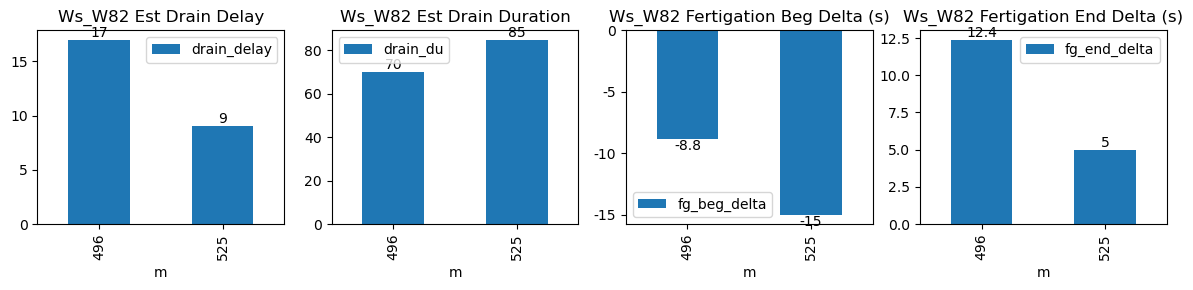
| ds | d | m | ws_name | prominence_cut | max_drain_du | fg_beg | fg_beg_est | fg_end | fg_end_est | ws_beg | ws_end | duc | pre_fg_et | post_fg_ws | post_drn_et | fg_rate_by_dydt | fg_rate_by_dWs | fg_stay_amount | enough_data | fg_beg_delta | fg_end_delta | fg_total_amount | fg_drain_amount | postFg_drain_amount | total_drain_amount | drain_du | drain_delay | drain_rate | field_capacity_est |
|---|---|---|---|---|---|---|---|---|---|---|---|---|---|---|---|---|---|---|---|---|---|---|---|---|---|---|---|---|---|
| 2026-02-27 08:16:14+08:00 | 144 | 496 | Ws_W82 | 0.955792 | 27.333333 | 496.23 | 496.083333 | 497.46 | 497.666667 | 3530.0 | 3672.846154 | 74 | 0.000000 | -0.011728 | 0.0 | 0.342755 | 0.386071 | 28.569231 | True | -8.8 | 12.4 | 29.378 | 0.000000 | 0.000000 | 0.000000 | 70 | 17 | -0.118031 | NaN |
| 2026-02-27 08:45:00+08:00 | 144 | 525 | Ws_W82 | 0.955792 | 30.000000 | 525.00 | 524.750000 | 526.25 | 526.333333 | 3660.0 | 3794.000000 | 75 | -0.004821 | -0.017901 | 0.0 | 0.315714 | 0.357333 | 26.800000 | True | -15.0 | 5.0 | 29.775 | 1.381552 | 2.763104 | 4.144656 | 85 | 9 | -0.132240 | 3780.184481 |