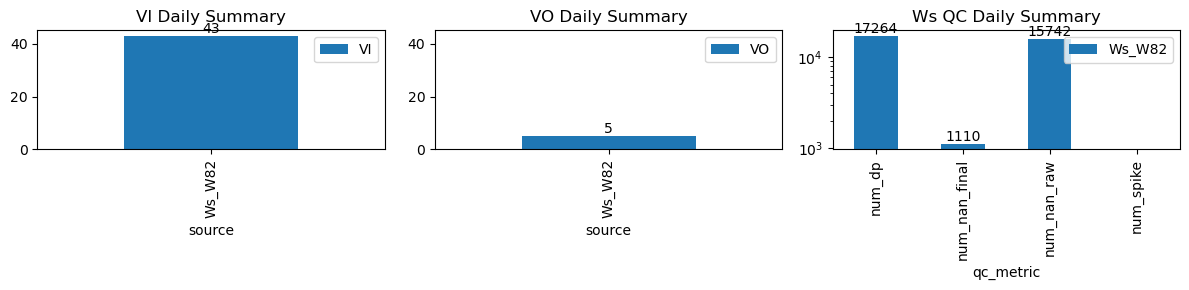
VI and VO Daily Summary
| ws_name | num_dp | num_nan_raw | num_nan_final | num_spike | cum_step_adj |
|---|---|---|---|---|---|
| Ws_W82 | 17,264 | 15,742 | 1,110 | 0 | 0.00 |
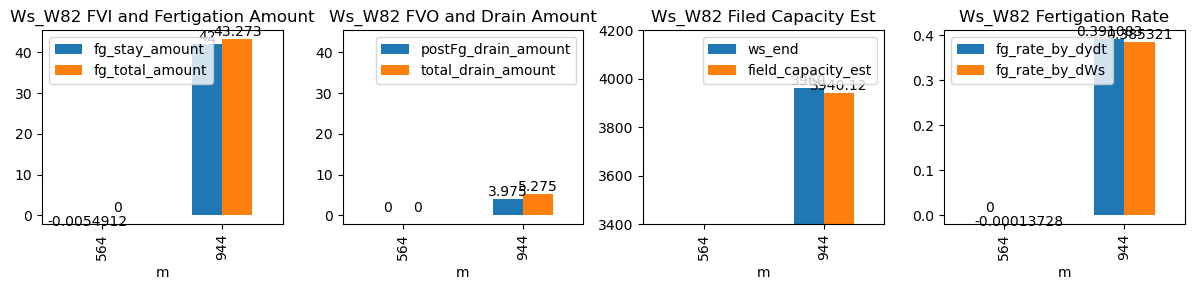
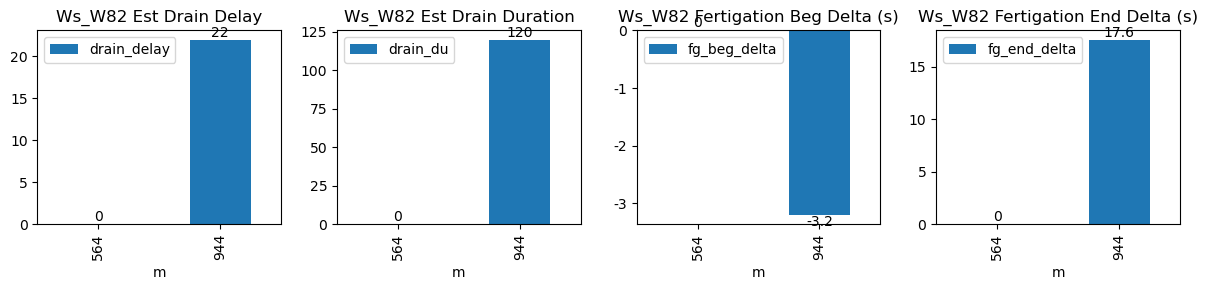
| ds | d | m | ws_name | prominence_cut | max_drain_du | fg_beg | fg_beg_est | fg_end | fg_end_est | ws_beg | ws_end | duc | pre_fg_et | post_fg_ws | post_drn_et | fg_rate_by_dydt | fg_rate_by_dWs | fg_stay_amount | enough_data | fg_beg_delta | fg_end_delta | fg_total_amount | fg_drain_amount | postFg_drain_amount | total_drain_amount | drain_du | drain_delay | drain_rate | field_capacity_est |
|---|---|---|---|---|---|---|---|---|---|---|---|---|---|---|---|---|---|---|---|---|---|---|---|---|---|---|---|---|---|
| 2026-03-01 09:24:59+08:00 | 146 | 564 | Ws_W82 | 1.657597 | 30 | 564.98 | NaN | 565.65 | NaN | NaN | NaN | 40 | -0.005491 | NaN | -0.005491 | NaN | -0.000137 | -0.005491 | False | NaN | NaN | NaN | NaN | NaN | NaN | NaN | NaN | NaN | NaN |
| 2026-03-01 15:44:58+08:00 | 146 | 944 | Ws_W82 | 1.657597 | 30 | 944.97 | 944.916667 | 946.79 | 947.083333 | 3750.0 | 3960.0 | 109 | 0.000000 | -0.029012 | 0.000000 | 0.391083 | 0.385321 | 42.000000 | True | -3.2 | 17.6 | 43.273 | 1.3 | 3.975 | 5.275 | 120.0 | 22.0 | -0.213889 | 3940.125 |