| 2026-03-02 07:47:27+08:00 |
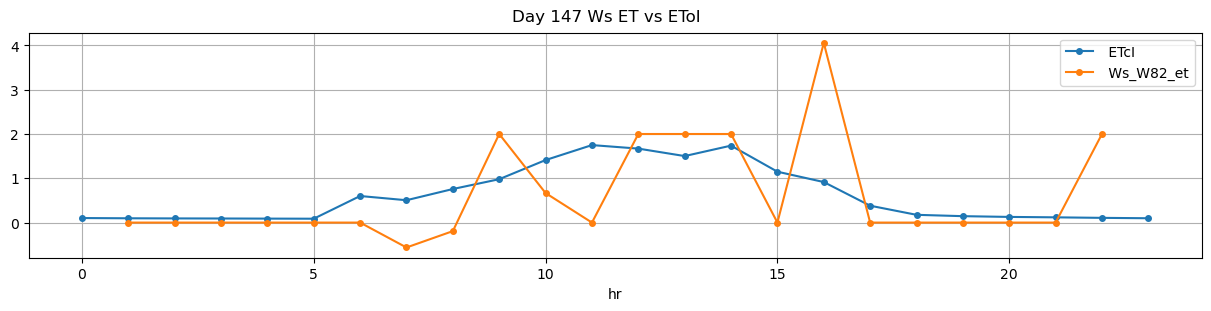
147 |
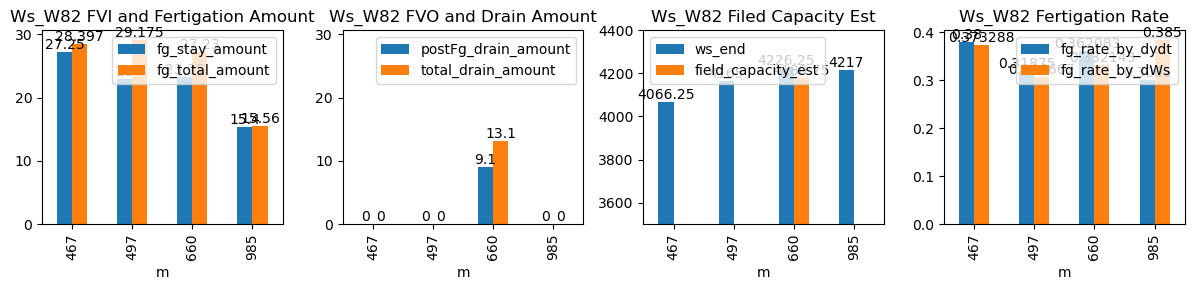
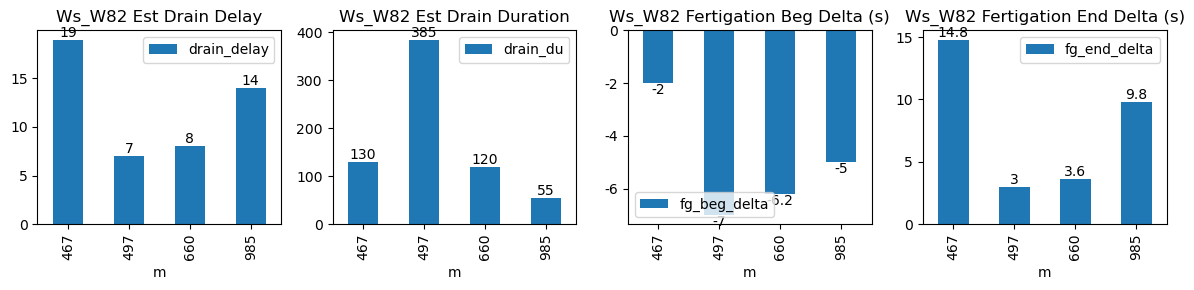
467 |
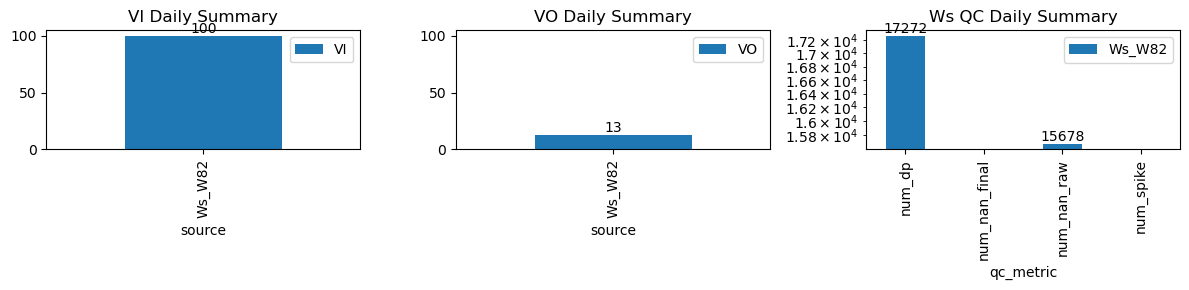
Ws_W82 |
2.163487 |
28.083333 |
467.45 |
467.416667 |
468.67 |
468.916667 |
3930.0 |
4066.25 |
73 |
0.000000 |
-0.028549 |
0.0 |
0.380000 |
0.373288 |
27.25 |
True |
-2.0 |
14.8 |
28.397 |
0.0 |
0.0 |
0.0 |
130 |
19 |
-0.121528 |
NaN |
| 2026-03-02 08:17:27+08:00 |
147 |
497 |
Ws_W82 |
2.163487 |
30.000000 |
497.45 |
497.333333 |
498.70 |
498.750000 |
4050.0 |
4165.00 |
75 |
-0.005262 |
-0.111111 |
0.0 |
0.318750 |
0.306667 |
23.00 |
True |
-7.0 |
3.0 |
29.175 |
0.0 |
0.0 |
0.0 |
385 |
7 |
-0.264253 |
NaN |
| 2026-03-02 11:00:01+08:00 |
147 |
660 |
Ws_W82 |
2.163487 |
30.000000 |
660.02 |
659.916667 |
661.19 |
661.250000 |
4110.0 |
4226.25 |
70 |
0.000000 |
-0.114815 |
0.0 |
0.362083 |
0.332143 |
23.25 |
True |
-6.2 |
3.6 |
27.230 |
4.0 |
9.1 |
13.1 |
120 |
8 |
-0.181944 |
4180.75 |
| 2026-03-02 16:25:00+08:00 |
147 |
985 |
Ws_W82 |
2.163487 |
30.000000 |
985.00 |
984.916667 |
985.67 |
985.833333 |
4140.0 |
4217.00 |
40 |
0.000000 |
-0.026049 |
0.0 |
0.300500 |
0.385000 |
15.40 |
True |
-5.0 |
9.8 |
15.560 |
0.0 |
0.0 |
0.0 |
55 |
14 |
-0.111111 |
NaN |