| 2026-03-06 08:10:42+08:00 |
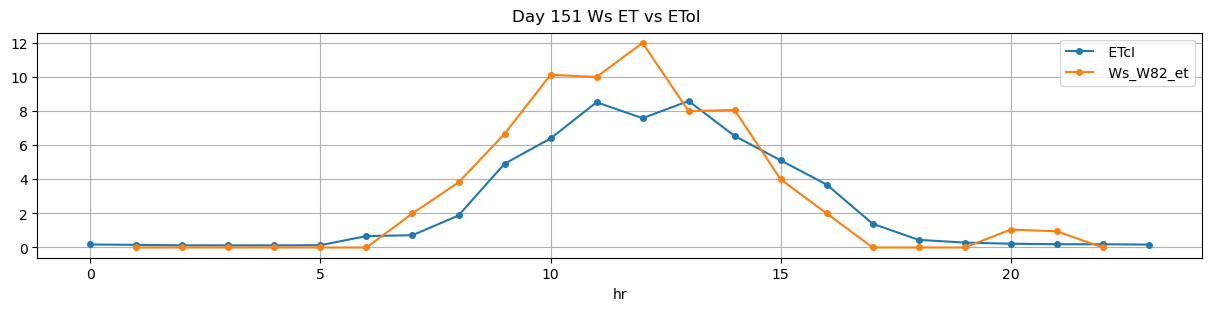
151 |
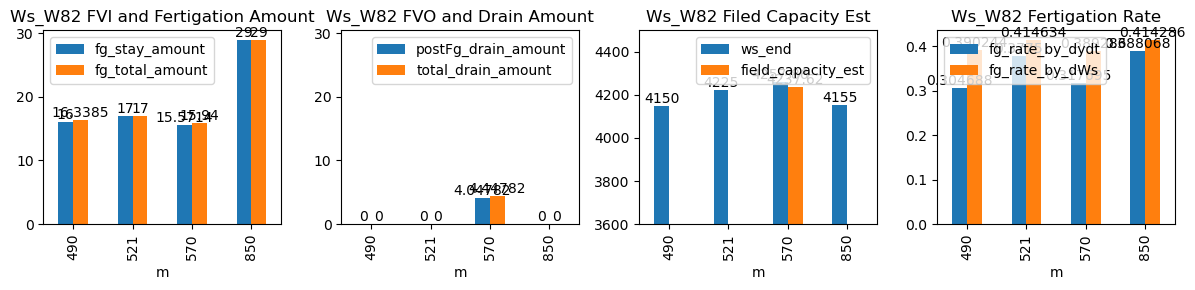
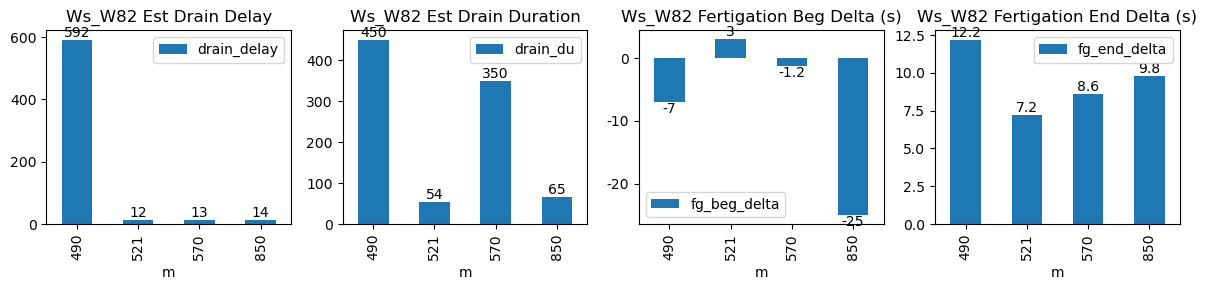
490 |
Ws_W82 |
1.985656 |
29.416667 |
490.70 |
490.583333 |
491.38 |
491.583333 |
4070.0 |
4150.000000 |
41 |
0.000000 |
0.000000 |
0.000000 |
0.304688 |
0.390244 |
16.000000 |
True |
-7.0 |
12.2 |
16.3385 |
0.0 |
0.00000 |
0.00000 |
450 |
592 |
-0.111111 |
NaN |
| 2026-03-06 08:41:12+08:00 |
151 |
521 |
Ws_W82 |
1.985656 |
30.000000 |
521.20 |
521.250000 |
521.88 |
522.000000 |
4140.0 |
4225.000000 |
41 |
-0.034108 |
-0.085185 |
-0.040123 |
0.377500 |
0.414634 |
17.000000 |
True |
3.0 |
7.2 |
17.0000 |
0.0 |
0.00000 |
0.00000 |
54 |
12 |
-0.076175 |
NaN |
| 2026-03-06 09:30:01+08:00 |
151 |
570 |
Ws_W82 |
1.985656 |
30.000000 |
570.02 |
570.000000 |
570.69 |
570.833333 |
4180.0 |
4257.857143 |
40 |
-0.048462 |
-0.114903 |
-0.066667 |
0.317695 |
0.389286 |
15.571429 |
True |
-1.2 |
8.6 |
15.9400 |
0.4 |
4.04782 |
4.44782 |
350 |
13 |
-0.173083 |
4237.618044 |
| 2026-03-06 14:10:00+08:00 |
151 |
850 |
Ws_W82 |
1.985656 |
30.000000 |
850.00 |
849.583333 |
851.17 |
851.333333 |
4010.0 |
4155.000000 |
70 |
-0.032516 |
-0.088889 |
-0.053704 |
0.388068 |
0.414286 |
29.000000 |
True |
-25.0 |
9.8 |
29.0000 |
0.0 |
0.00000 |
0.00000 |
65 |
14 |
-0.076700 |
NaN |