| 2026-03-07 08:05:00+08:00 |
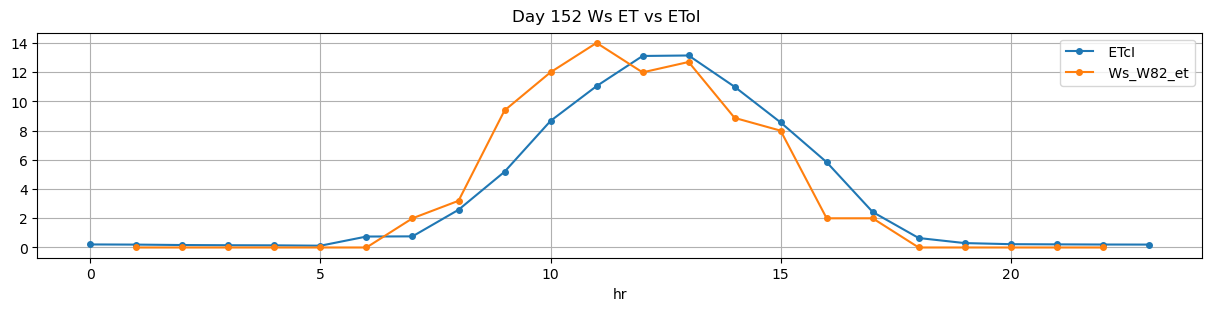
152 |
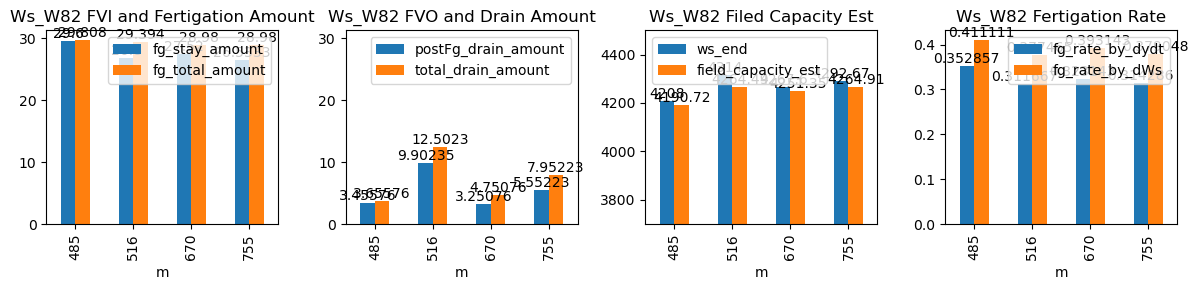
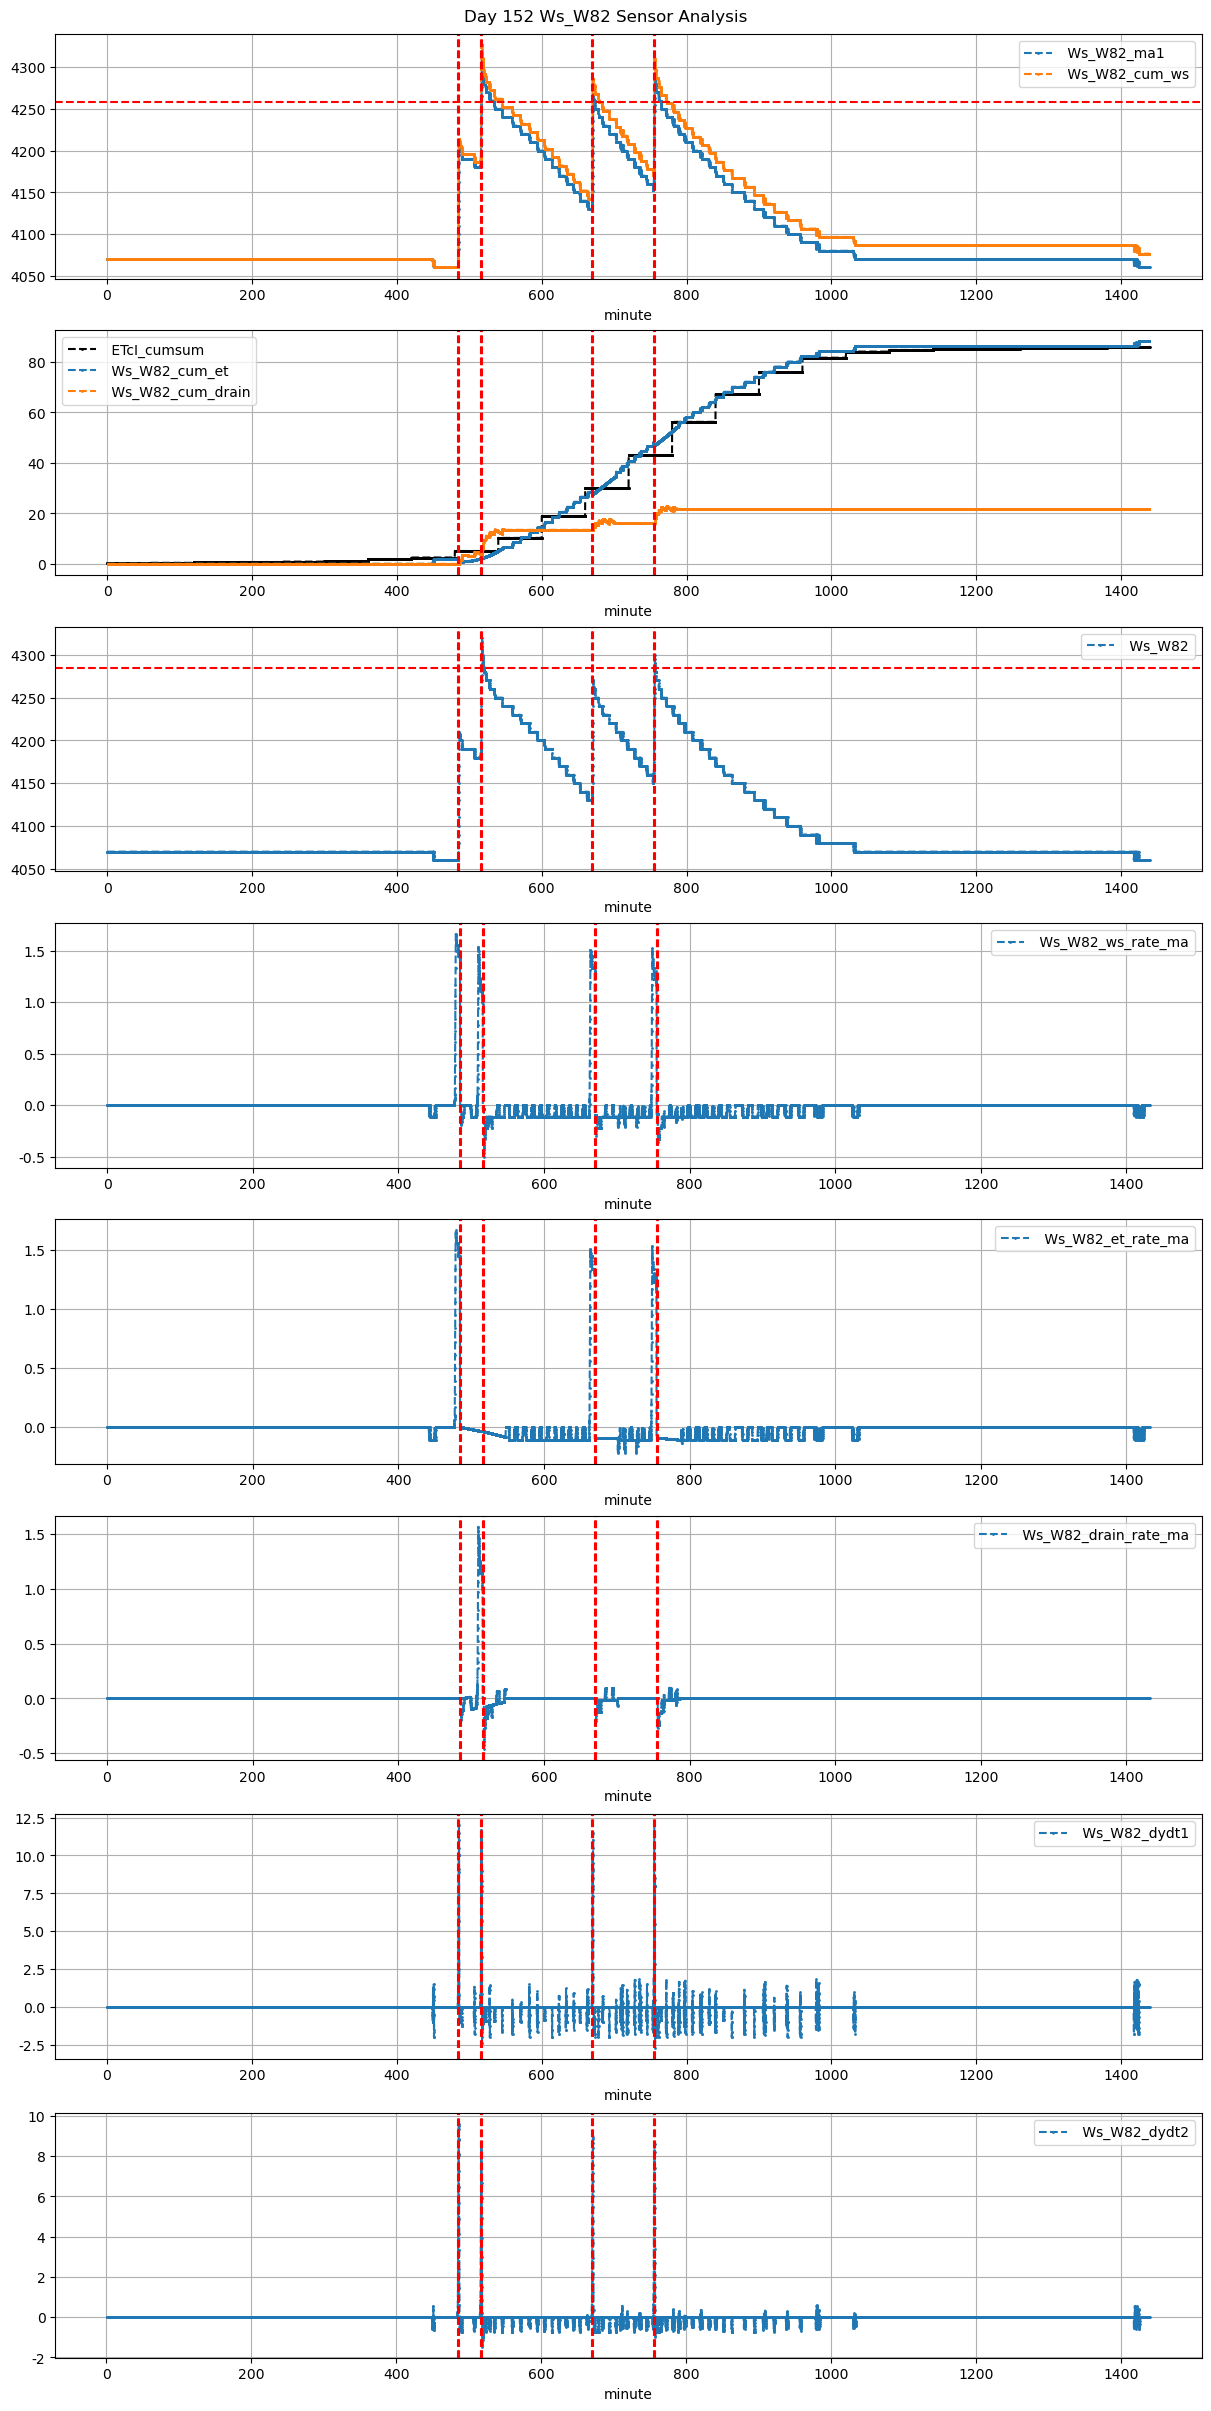
485 |
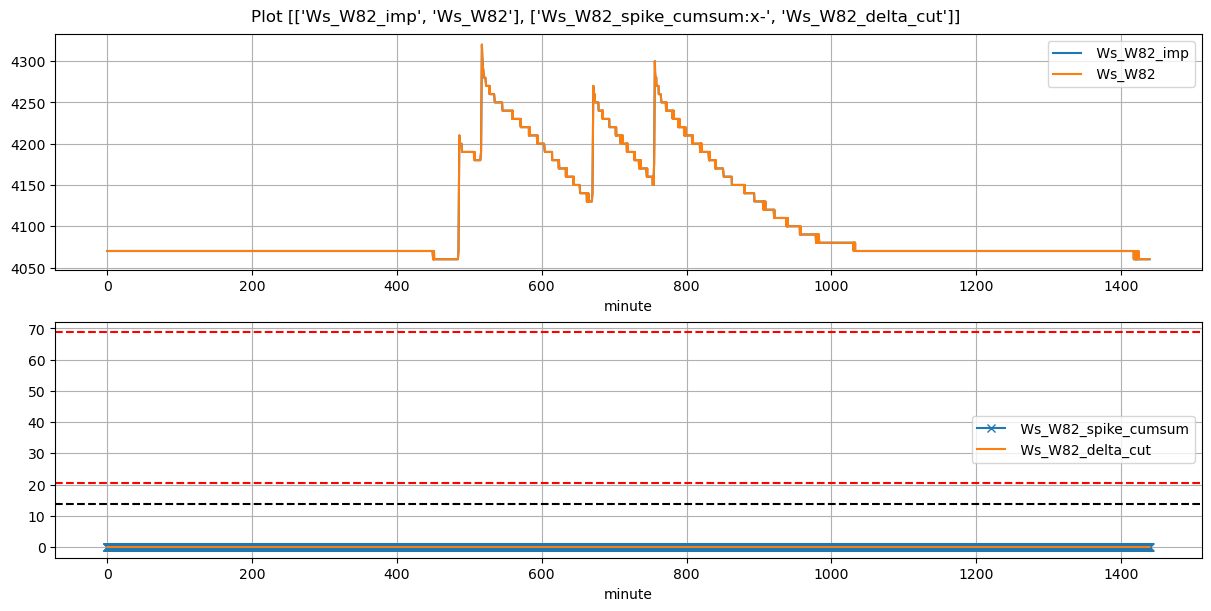
Ws_W82 |
0.650748 |
29.583333 |
485.00 |
484.750000 |
486.20 |
486.416667 |
4060.0 |
4208.000000 |
72 |
0.000000 |
-0.053148 |
0.000000 |
0.352857 |
0.411111 |
29.600000 |
True |
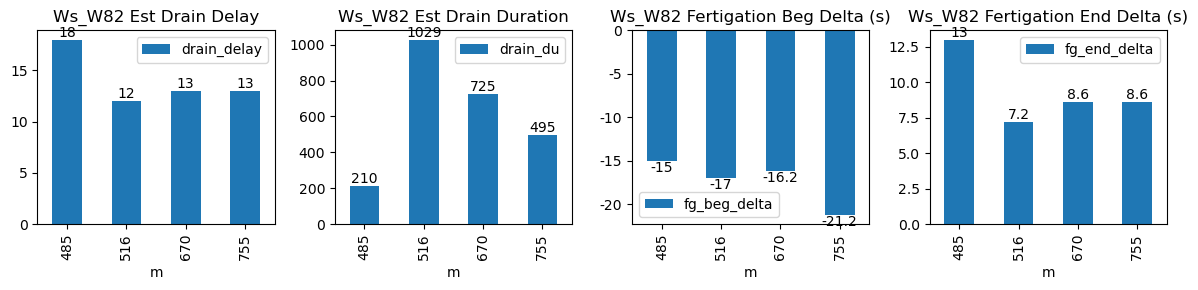
-15.0 |
13.0 |
29.808 |
0.2 |
3.455755 |
3.655755 |
210 |
18 |
-0.115287 |
4190.721223 |
| 2026-03-07 08:36:12+08:00 |
152 |
516 |
Ws_W82 |
0.650748 |
30.000000 |
516.20 |
515.916667 |
517.38 |
517.500000 |
4180.0 |
4314.000000 |
71 |
-0.036008 |
-0.206173 |
-0.082716 |
0.311667 |
0.377465 |
26.800000 |
True |
-17.0 |
7.2 |
29.394 |
2.6 |
9.902346 |
12.502346 |
1029 |
12 |
-0.226956 |
4264.488272 |
| 2026-03-07 11:10:01+08:00 |
152 |
670 |
Ws_W82 |
0.650748 |
30.000000 |
670.02 |
669.750000 |
671.19 |
671.333333 |
4130.0 |
4267.600000 |
70 |
-0.094195 |
-0.175309 |
-0.093378 |
0.323143 |
0.393143 |
27.520000 |
True |
-16.2 |
8.6 |
28.980 |
1.5 |
3.250758 |
4.750758 |
725 |
13 |
-0.128189 |
4251.346209 |
| 2026-03-07 12:35:01+08:00 |
152 |
755 |
Ws_W82 |
0.650748 |
30.000000 |
755.02 |
754.666667 |
756.19 |
756.333333 |
4160.0 |
4292.666667 |
70 |
-0.089263 |
-0.209259 |
-0.105556 |
0.314286 |
0.379048 |
26.533333 |
True |
-21.2 |
8.6 |
28.980 |
2.4 |
5.552229 |
7.952229 |
495 |
13 |
-0.191678 |
4264.905521 |