| 2026-03-20 08:15:01+08:00 |
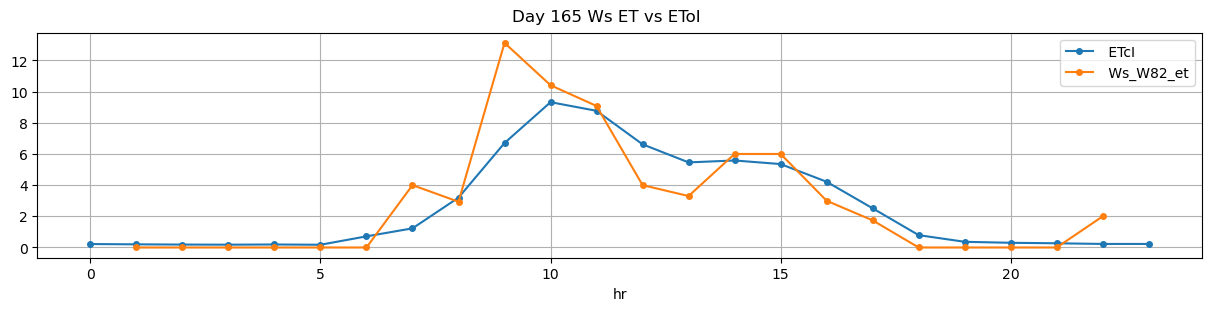
165 |
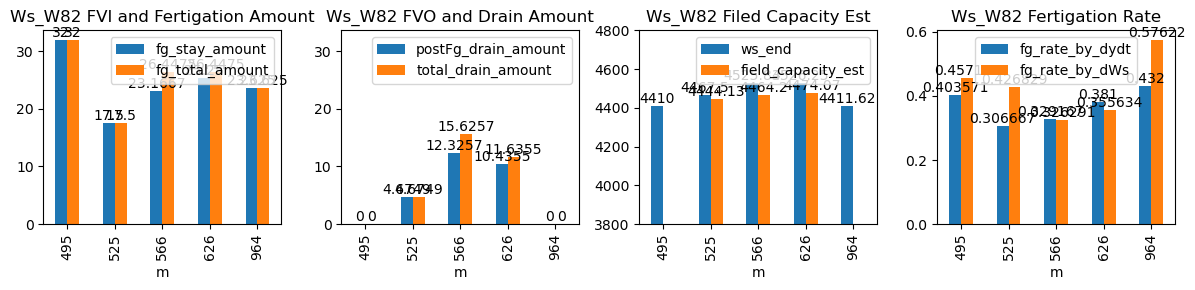
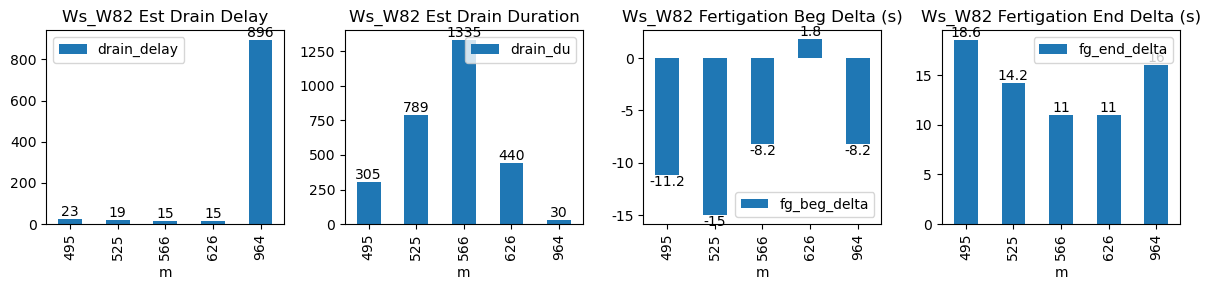
495 |
Ws_W82 |
9.084305 |
28.5 |
495.02 |
494.833333 |
496.19 |
496.500000 |
4250.0 |
4410.000000 |
70 |
0.000000 |
-0.075926 |
0.000000 |
0.403571 |
0.457143 |
32.000000 |
True |
-11.2 |
18.6 |
32.0000 |
0.0 |
0.000000 |
0.000000 |
305 |
23 |
-0.109917 |
NaN |
| 2026-03-20 08:45:00+08:00 |
165 |
525 |
Ws_W82 |
9.084305 |
30.0 |
525.00 |
524.750000 |
525.68 |
525.916667 |
4380.0 |
4467.500000 |
41 |
-0.046535 |
-0.172325 |
-0.084568 |
0.306667 |
0.426829 |
17.500000 |
True |
-15.0 |
14.2 |
17.5000 |
0.0 |
4.674904 |
4.674904 |
789 |
19 |
-0.173965 |
4444.125480 |
| 2026-03-20 09:26:13+08:00 |
165 |
566 |
Ws_W82 |
9.084305 |
30.0 |
566.22 |
566.083333 |
567.40 |
567.583333 |
4410.0 |
4525.833333 |
71 |
-0.101566 |
-0.247942 |
-0.090404 |
0.329167 |
0.326291 |
23.166667 |
True |
-8.2 |
11.0 |
26.4475 |
3.3 |
12.325672 |
15.625672 |
1335 |
15 |
-0.205889 |
4464.204972 |
| 2026-03-20 10:26:13+08:00 |
165 |
626 |
Ws_W82 |
9.084305 |
30.0 |
626.22 |
626.250000 |
627.40 |
627.583333 |
4400.0 |
4526.250000 |
71 |
-0.070741 |
-0.245576 |
-0.114198 |
0.381000 |
0.355634 |
25.250000 |
True |
1.8 |
11.0 |
26.4475 |
1.2 |
10.435521 |
11.635521 |
440 |
15 |
-0.274122 |
4474.072396 |
| 2026-03-20 16:04:28+08:00 |
165 |
964 |
Ws_W82 |
9.084305 |
30.0 |
964.47 |
964.333333 |
965.15 |
965.416667 |
4293.5 |
4411.625000 |
41 |
-0.098127 |
-0.005941 |
-0.034182 |
0.432000 |
0.576220 |
23.625000 |
True |
-8.2 |
16.0 |
23.6250 |
0.0 |
0.000000 |
0.000000 |
30 |
896 |
-0.087242 |
NaN |