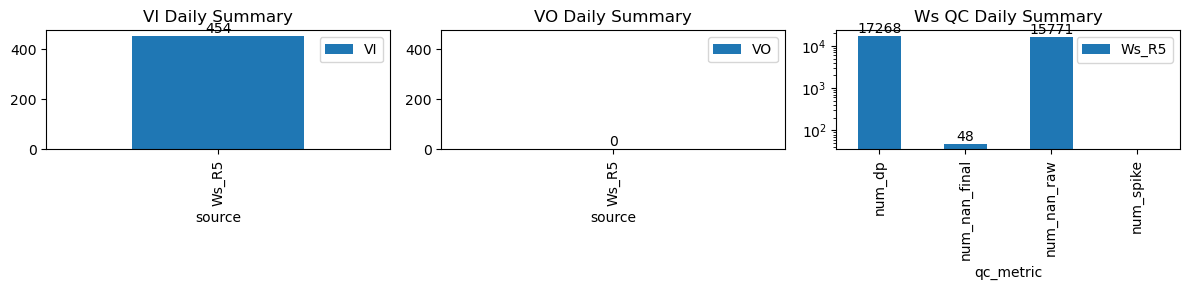
VI and VO Daily Summary
| ws_name | num_dp | num_nan_raw | num_nan_final | num_spike | cum_step_adj |
|---|---|---|---|---|---|
| Ws_R5 | 17,268 | 15,771 | 48 | 0 | 0.00 |
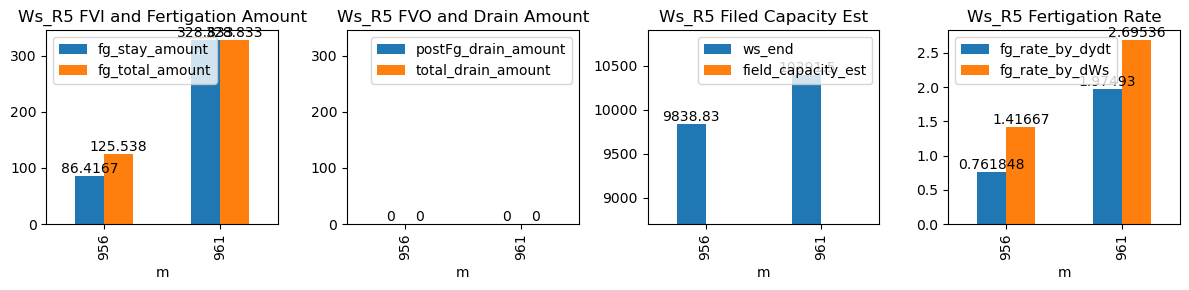
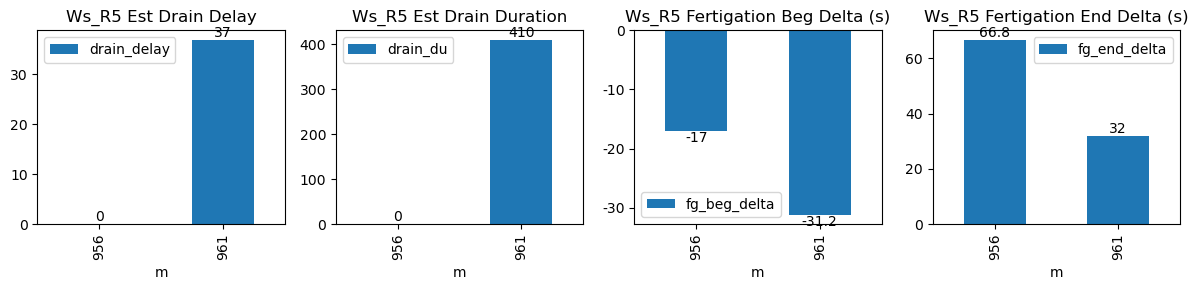
| ds | d | m | ws_name | prominence_cut | max_drain_du | fg_beg | fg_beg_est | fg_end | fg_end_est | ws_beg | ws_end | duc | pre_fg_et | post_fg_ws | post_drn_et | fg_rate_by_dydt | fg_rate_by_dWs | fg_stay_amount | enough_data | fg_beg_delta | fg_end_delta | fg_total_amount | fg_drain_amount | postFg_drain_amount | total_drain_amount | drain_du | drain_delay | drain_rate | field_capacity_est |
|---|---|---|---|---|---|---|---|---|---|---|---|---|---|---|---|---|---|---|---|---|---|---|---|---|---|---|---|---|---|
| 2026-03-31 15:56:27+08:00 | 160 | 956 | Ws_R5 | 0.22034 | 2.583333 | 956.45 | 956.166667 | 957.47 | 958.416667 | 9666.000000 | 9839.0 | 61 | -0.012276 | 0.000000 | 0.000 | 0.776250 | 1.418033 | 86.500000 | True | -17.0 | 56.8 | 125.538000 | 0.0 | 0.000000 | 0.000000 | 54 | 76 | -0.083333 | NaN |
| 2026-03-31 16:01:01+08:00 | 160 | 961 | Ws_R5 | 0.22034 | 50.000000 | 961.02 | 960.500000 | 963.05 | 963.416667 | 9733.833333 | 10392.0 | 122 | 0.000000 | -0.036354 | -0.005 | 1.991319 | 2.697404 | 329.083333 | True | -31.2 | 22.0 | 329.083333 | 0.0 | 1.489142 | 1.489142 | 120 | 37 | -0.249959 | NaN |