VI and VO Daily Summary
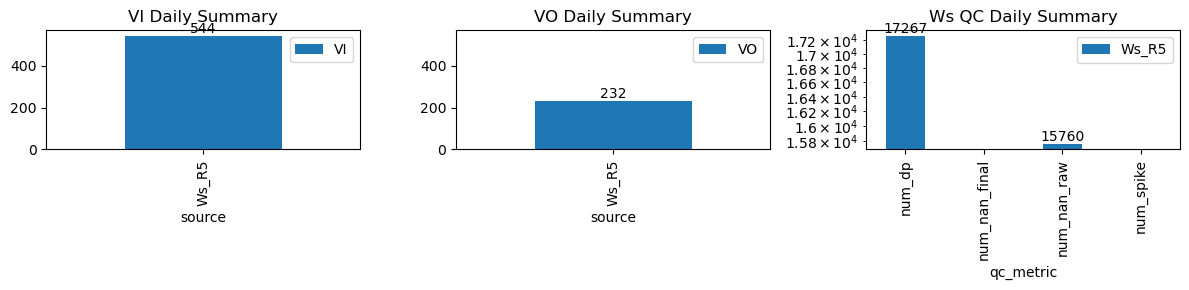
| ws_name | num_dp | num_nan_raw | num_nan_final | num_spike | cum_step_adj |
|---|---|---|---|---|---|
| Ws_R5 | 17,267 | 15,760 | 0 | 0 | 0.00 |
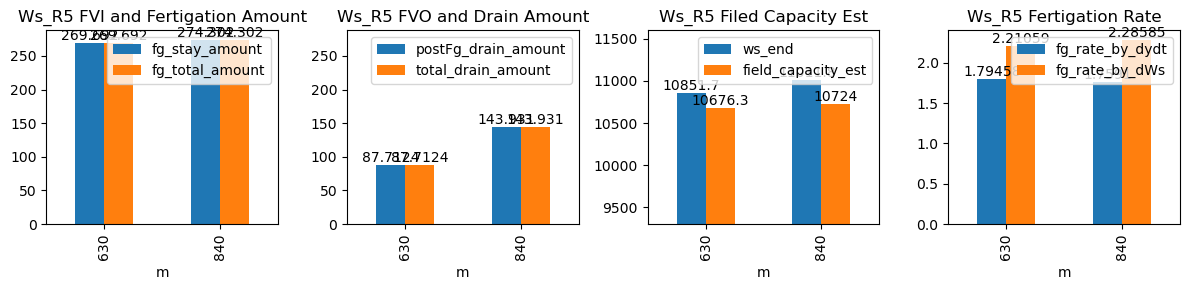
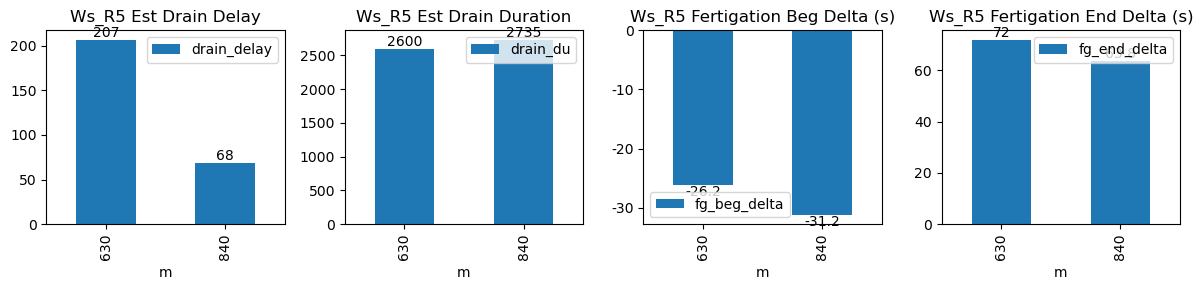
| ds | d | m | ws_name | prominence_cut | max_drain_du | fg_beg | fg_beg_est | fg_end | fg_end_est | ws_beg | ws_end | duc | pre_fg_et | post_fg_ws | post_drn_et | fg_rate_by_dydt | fg_rate_by_dWs | fg_stay_amount | enough_data | fg_beg_delta | fg_end_delta | fg_total_amount | fg_drain_amount | postFg_drain_amount | total_drain_amount | drain_du | drain_delay | drain_rate | field_capacity_est |
|---|---|---|---|---|---|---|---|---|---|---|---|---|---|---|---|---|---|---|---|---|---|---|---|---|---|---|---|---|---|
| 2026-04-01 10:30:01+08:00 | 161 | 630 | Ws_R5 | 0.918289 | 50 | 630.02 | 629.583333 | 632.05 | 633.166667 | 10311.883333 | 10852.0 | 122 | -0.109205 | -0.828106 | -0.093229 | 1.794896 | 2.213593 | 270.058333 | True | -26.2 | 67.0 | 270.058333 | 0.0 | 85.854805 | 85.854805 | 1800 | 512 | -0.976488 | 10680.290390 |
| 2026-04-01 14:00:01+08:00 | 161 | 840 | Ws_R5 | 0.918289 | 50 | 840.02 | 839.500000 | 842.02 | 843.250000 | 10463.000000 | 11012.0 | 120 | -0.090407 | -1.761447 | -0.091284 | 1.735069 | 2.287500 | 274.500000 | True | -31.2 | 73.8 | 274.500000 | 0.0 | 145.825654 | 145.825654 | 300 | 213 | -2.409551 | 10720.348692 |