VI and VO Daily Summary
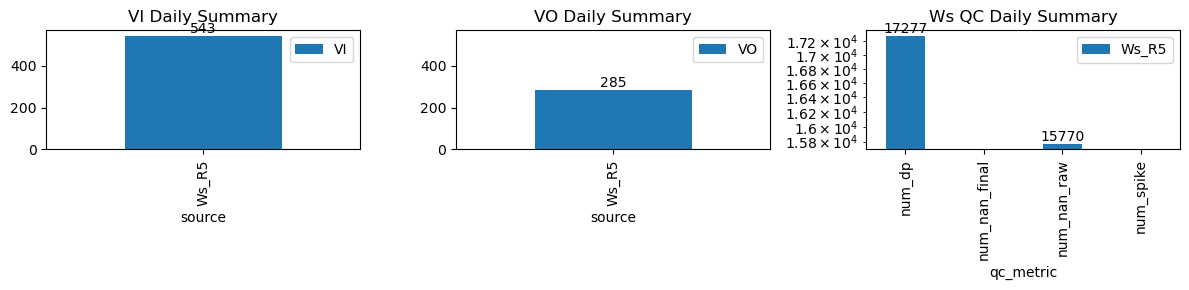
| ws_name | num_dp | num_nan_raw | num_nan_final | num_spike | cum_step_adj |
|---|---|---|---|---|---|
| Ws_R5 | 17,277 | 15,770 | 0 | 0 | 0.00 |
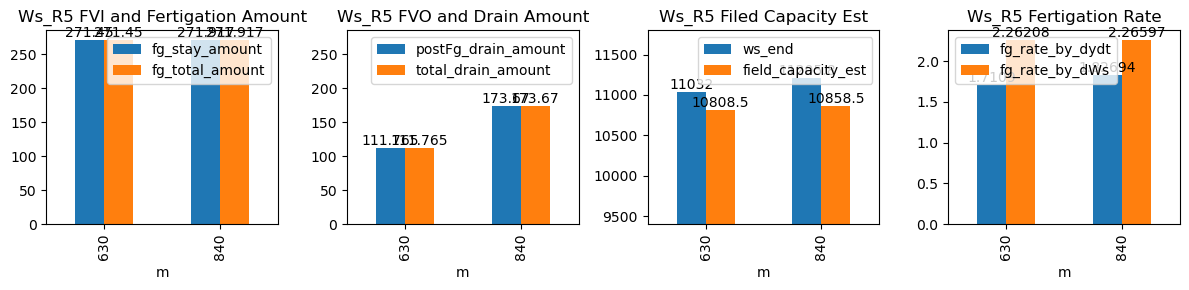
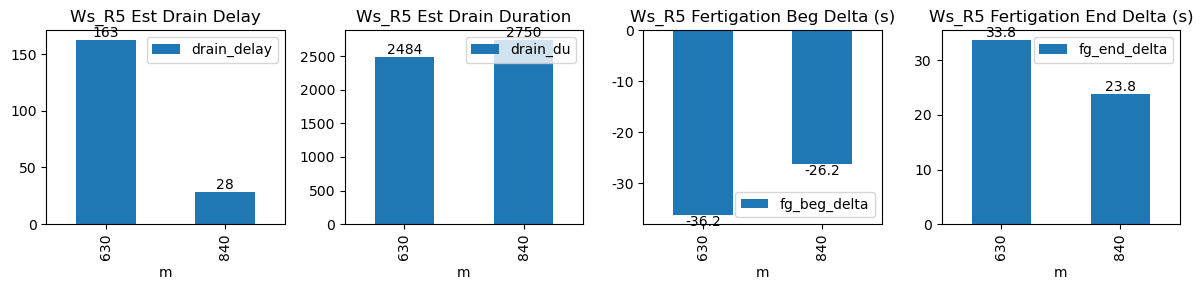
| ds | d | m | ws_name | prominence_cut | max_drain_du | fg_beg | fg_beg_est | fg_end | fg_end_est | ws_beg | ws_end | duc | pre_fg_et | post_fg_ws | post_drn_et | fg_rate_by_dydt | fg_rate_by_dWs | fg_stay_amount | enough_data | fg_beg_delta | fg_end_delta | fg_total_amount | fg_drain_amount | postFg_drain_amount | total_drain_amount | drain_du | drain_delay | drain_rate | field_capacity_est |
|---|---|---|---|---|---|---|---|---|---|---|---|---|---|---|---|---|---|---|---|---|---|---|---|---|---|---|---|---|---|
| 2026-04-02 10:30:01+08:00 | 162 | 630 | Ws_R5 | 1.085557 | 50 | 630.02 | 629.416667 | 632.02 | 632.583333 | 10489.1 | 11032.000000 | 120 | -0.035055 | -0.987639 | -0.07251 | 1.710903 | 2.262083 | 271.450000 | True | -36.2 | 33.8 | 271.450000 | 0.0 | 111.764978 | 111.764978 | 2484 | 163 | -1.035315 | 10808.470043 |
| 2026-04-02 14:00:01+08:00 | 162 | 840 | Ws_R5 | 1.085557 | 50 | 840.02 | 839.583333 | 842.02 | 842.416667 | 10662.0 | 11205.833333 | 120 | -0.027840 | -1.633699 | -0.07768 | 1.826944 | 2.265972 | 271.916667 | True | -26.2 | 23.8 | 271.916667 | 0.0 | 173.669994 | 173.669994 | 2750 | 28 | -1.916363 | 10858.493345 |