VI and VO Daily Summary
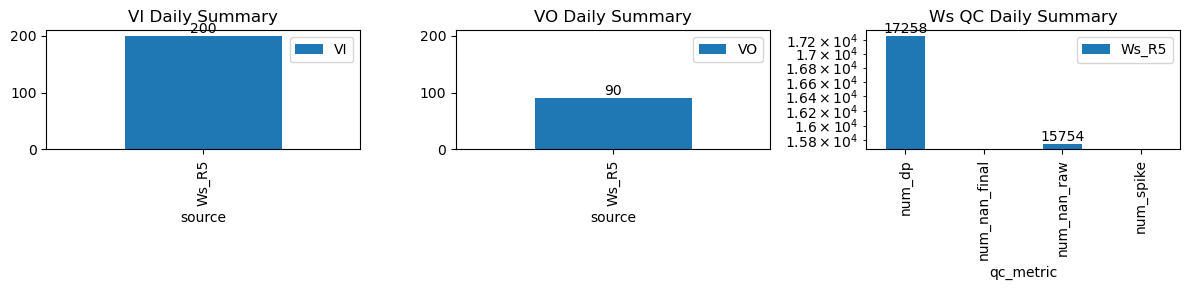
| ws_name | num_dp | num_nan_raw | num_nan_final | num_spike | cum_step_adj |
|---|---|---|---|---|---|
| Ws_R5 | 17,258 | 15,754 | 0 | 0 | 0.00 |
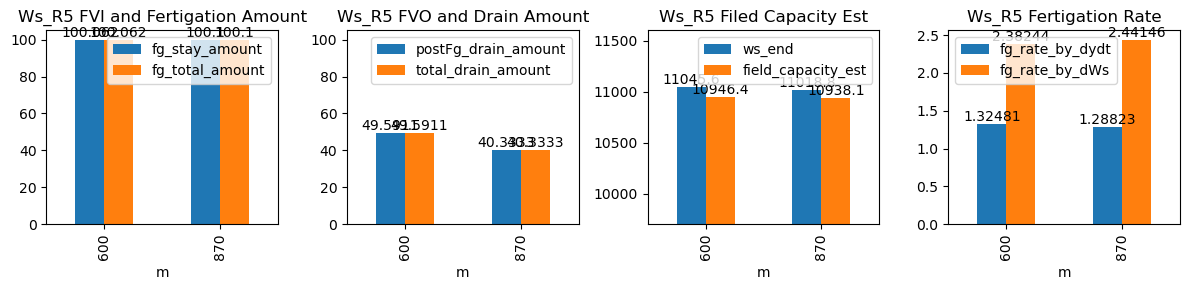
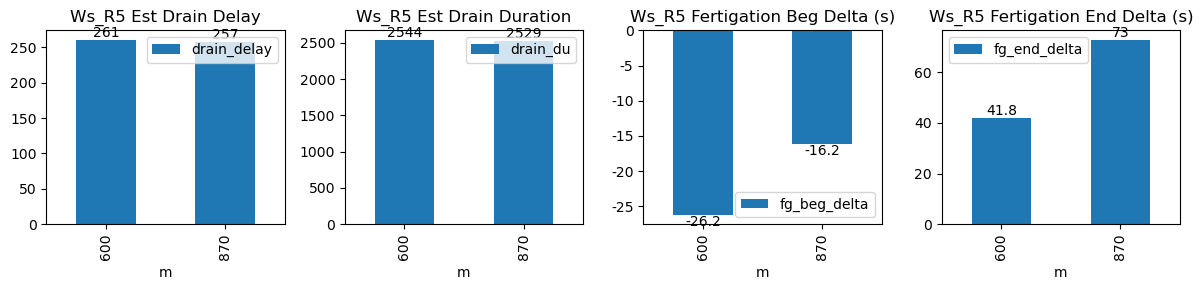
| ds | d | m | ws_name | prominence_cut | max_drain_du | fg_beg | fg_beg_est | fg_end | fg_end_est | ws_beg | ws_end | duc | pre_fg_et | post_fg_ws | post_drn_et | fg_rate_by_dydt | fg_rate_by_dWs | fg_stay_amount | enough_data | fg_beg_delta | fg_end_delta | fg_total_amount | fg_drain_amount | postFg_drain_amount | total_drain_amount | drain_du | drain_delay | drain_rate | field_capacity_est |
|---|---|---|---|---|---|---|---|---|---|---|---|---|---|---|---|---|---|---|---|---|---|---|---|---|---|---|---|---|---|
| 2026-04-04 10:00:01+08:00 | 164 | 600 | Ws_R5 | 0.370659 | 50 | 600.02 | 599.583333 | 600.72 | 601.25 | 10845.333333 | 11046.0 | 42 | -0.015807 | -0.305293 | -0.036995 | 1.333534 | 2.388889 | 100.333333 | True | -26.2 | 31.8 | 100.333333 | 0.0 | 47.010729 | 47.010729 | 1155 | 346 | -0.674136 | 10951.978541 |
| 2026-04-04 14:30:01+08:00 | 164 | 870 | Ws_R5 | 0.370659 | 50 | 870.02 | 869.750000 | 870.70 | 871.75 | 10818.050000 | 11019.0 | 41 | -0.047787 | -0.416157 | -0.058565 | 1.310885 | 2.450610 | 100.475000 | True | -16.2 | 63.0 | 100.475000 | 0.0 | 43.463554 | 43.463554 | 240 | 382 | -0.617720 | 10932.072892 |