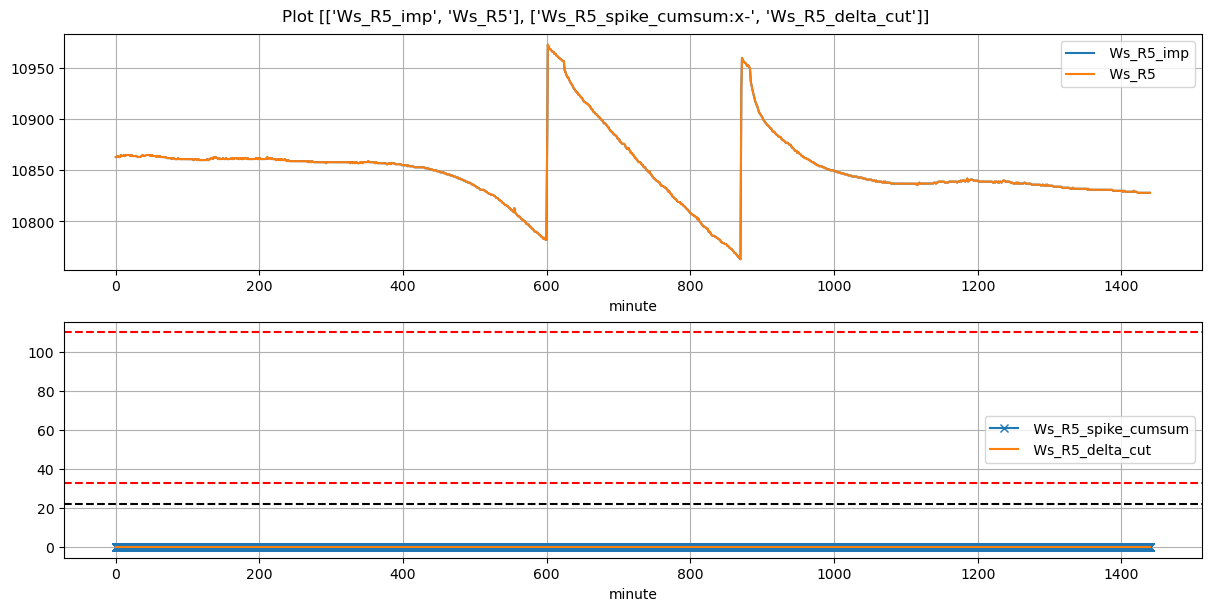
VI and VO Daily Summary
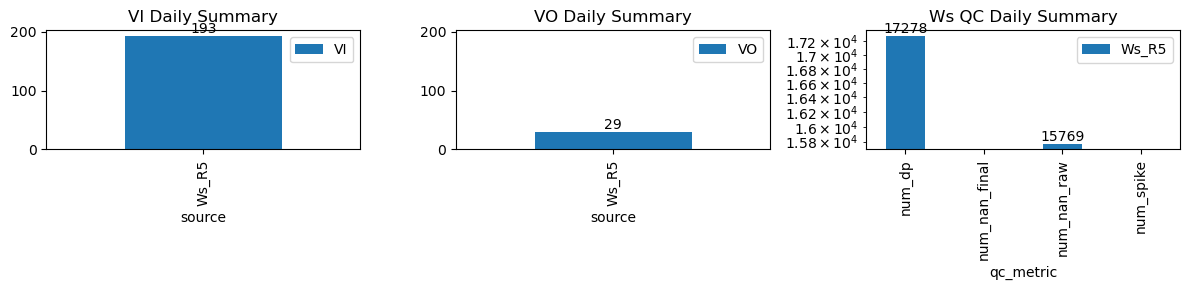
| ws_name | num_dp | num_nan_raw | num_nan_final | num_spike | cum_step_adj |
|---|---|---|---|---|---|
| Ws_R5 | 17,278 | 15,769 | 0 | 0 | 0.00 |
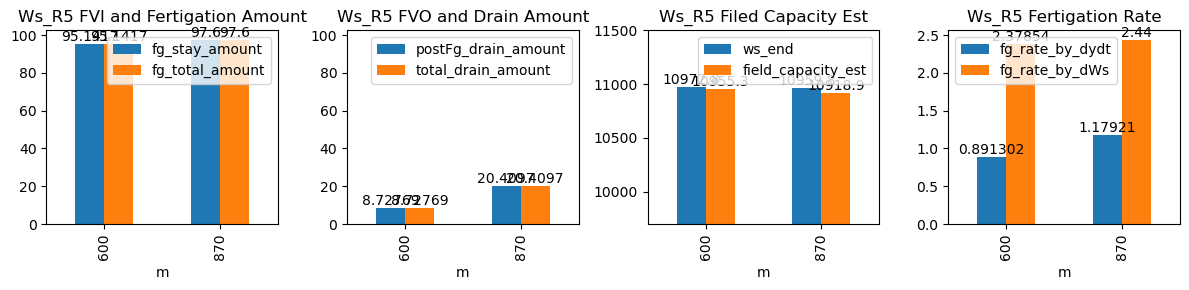
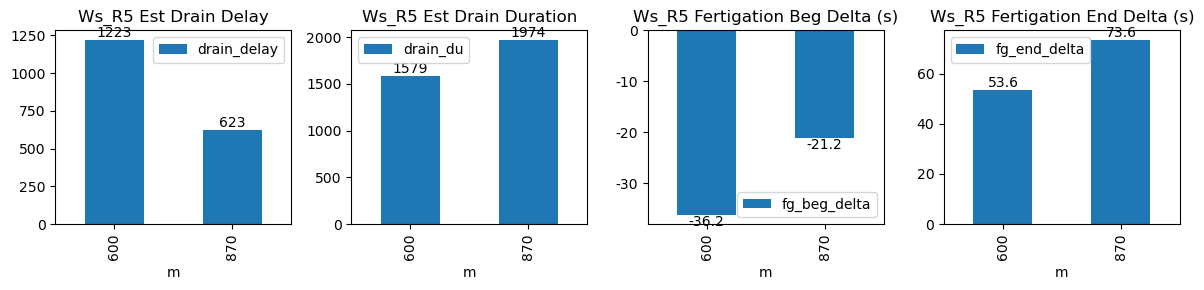
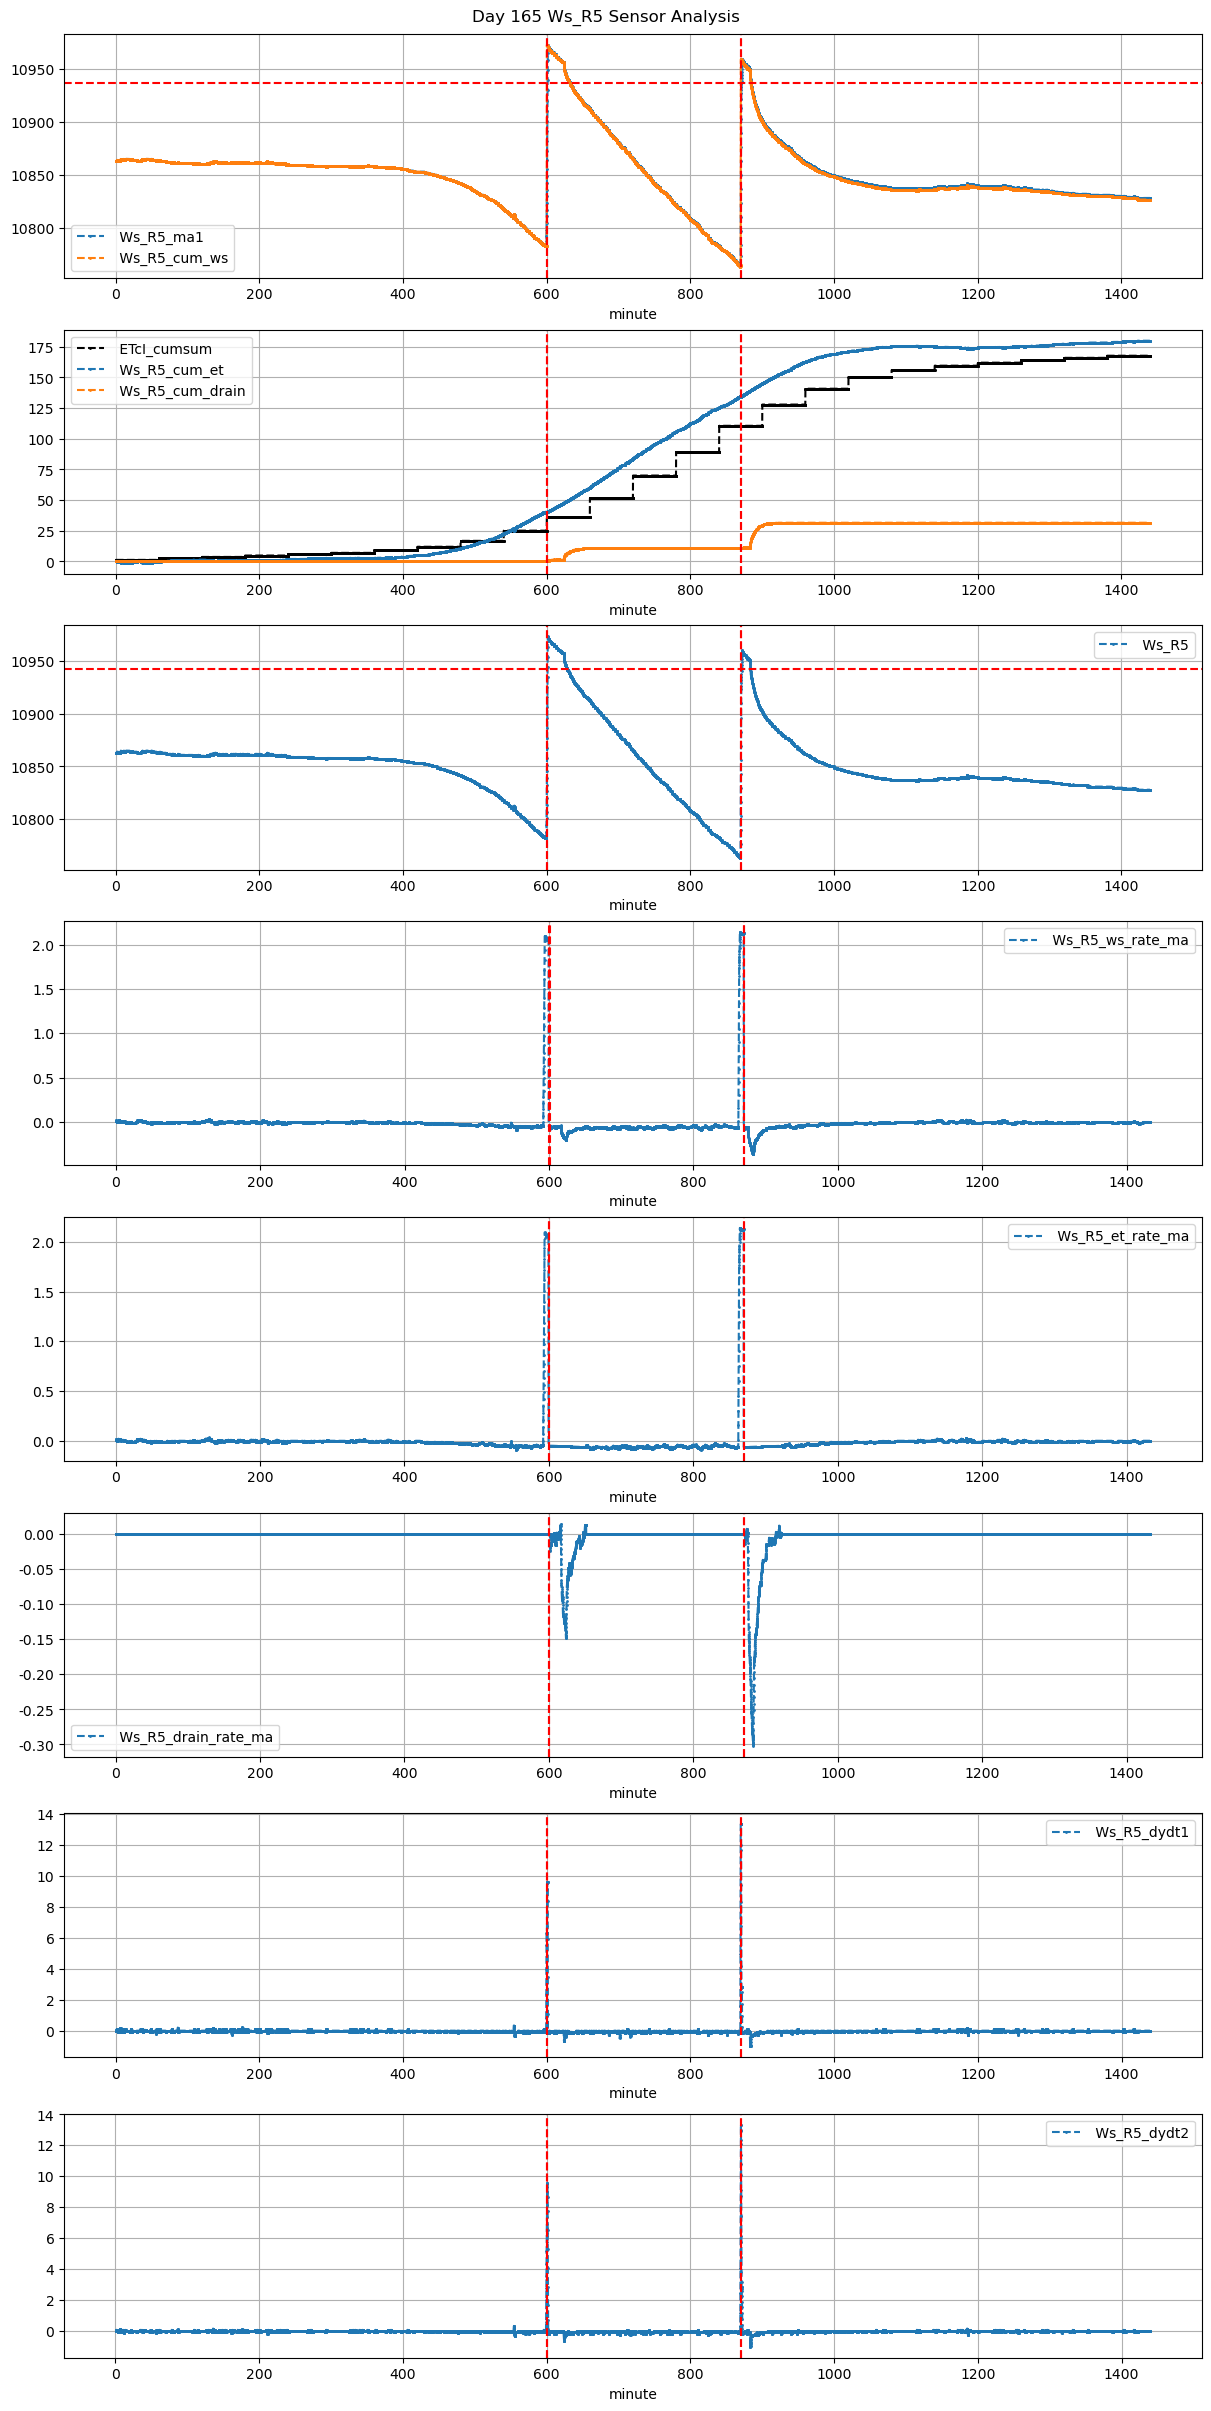
| ds | d | m | ws_name | prominence_cut | max_drain_du | fg_beg | fg_beg_est | fg_end | fg_end_est | ws_beg | ws_end | duc | pre_fg_et | post_fg_ws | post_drn_et | fg_rate_by_dydt | fg_rate_by_dWs | fg_stay_amount | enough_data | fg_beg_delta | fg_end_delta | fg_total_amount | fg_drain_amount | postFg_drain_amount | total_drain_amount | drain_du | drain_delay | drain_rate | field_capacity_est |
|---|---|---|---|---|---|---|---|---|---|---|---|---|---|---|---|---|---|---|---|---|---|---|---|---|---|---|---|---|---|
| 2026-04-05 10:00:01+08:00 | 165 | 600 | Ws_R5 | 0.306553 | 50 | 600.02 | 599.416667 | 600.69 | 601.583333 | 10782.466667 | 10972.75 | 40 | -0.049183 | -0.057608 | -0.063822 | 0.891302 | 2.378542 | 95.141667 | True | -36.2 | 53.6 | 95.141667 | 0.0 | 8.727694 | 8.727694 | 1579 | 1223 | -0.124484 | 10955.294611 |
| 2026-04-05 14:30:01+08:00 | 165 | 870 | Ws_R5 | 0.306553 | 50 | 870.02 | 869.666667 | 870.69 | 871.916667 | 10764.550000 | 10959.75 | 40 | -0.063296 | -0.140273 | -0.050998 | 1.179211 | 2.440000 | 97.600000 | True | -21.2 | 73.6 | 97.600000 | 0.0 | 20.409740 | 20.409740 | 1974 | 623 | -0.269455 | 10918.930520 |