VI and VO Daily Summary
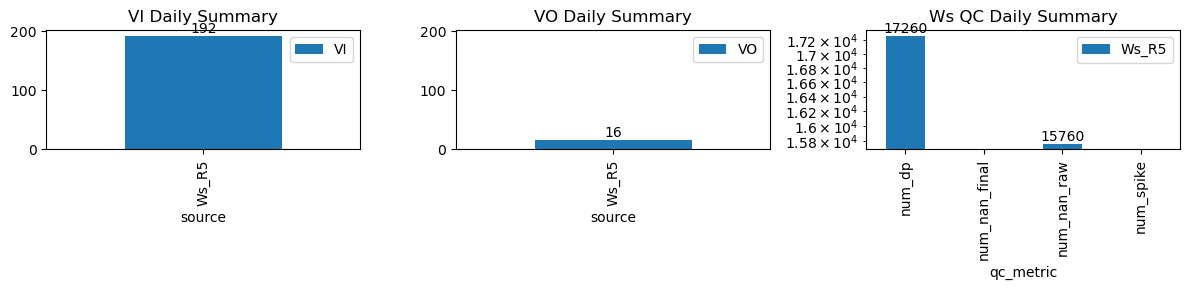
| ws_name | num_dp | num_nan_raw | num_nan_final | num_spike | cum_step_adj |
|---|---|---|---|---|---|
| Ws_R5 | 17,260 | 15,760 | 0 | 0 | 0.00 |
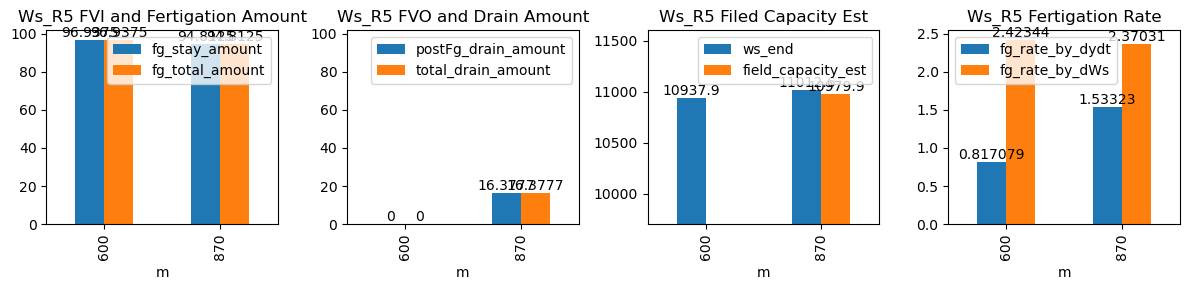
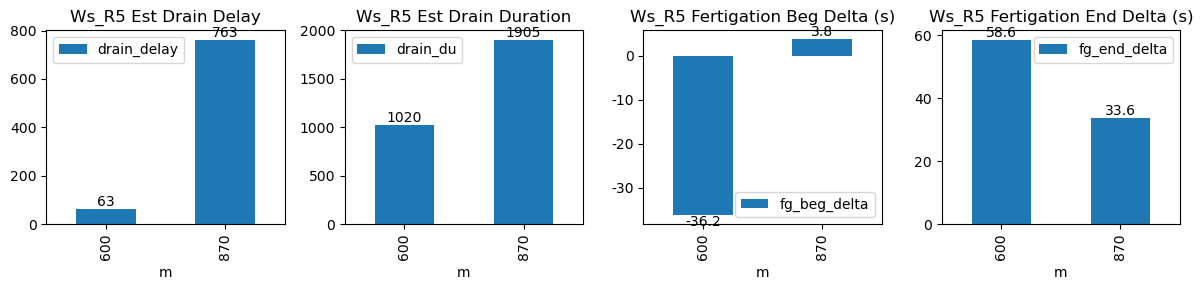
| ds | d | m | ws_name | prominence_cut | max_drain_du | fg_beg | fg_beg_est | fg_end | fg_end_est | ws_beg | ws_end | duc | pre_fg_et | post_fg_ws | post_drn_et | fg_rate_by_dydt | fg_rate_by_dWs | fg_stay_amount | enough_data | fg_beg_delta | fg_end_delta | fg_total_amount | fg_drain_amount | postFg_drain_amount | total_drain_amount | drain_du | drain_delay | drain_rate | field_capacity_est |
|---|---|---|---|---|---|---|---|---|---|---|---|---|---|---|---|---|---|---|---|---|---|---|---|---|---|---|---|---|---|
| 2026-04-06 10:00:01+08:00 | 166 | 600 | Ws_R5 | 0.220223 | 50 | 600.02 | 599.416667 | 600.69 | 601.500000 | 10744.0 | 10938.0 | 40 | -0.022363 | -0.062589 | -0.033472 | 0.823177 | 2.425 | 97.0 | True | -36.2 | 48.6 | 97.0 | 0.0 | 0.00000 | 0.00000 | 19 | 1553 | -0.187424 | NaN |
| 2026-04-06 14:30:01+08:00 | 166 | 870 | Ws_R5 | 0.220223 | 50 | 870.02 | 870.083333 | 870.69 | 871.083333 | 10823.0 | 11013.0 | 40 | -0.024626 | -0.050401 | -0.042755 | 1.533542 | 2.375 | 95.0 | True | 3.8 | 23.6 | 95.0 | 0.0 | 14.51146 | 14.51146 | 1320 | 888 | -0.720004 | 10983.97708 |