VI and VO Daily Summary
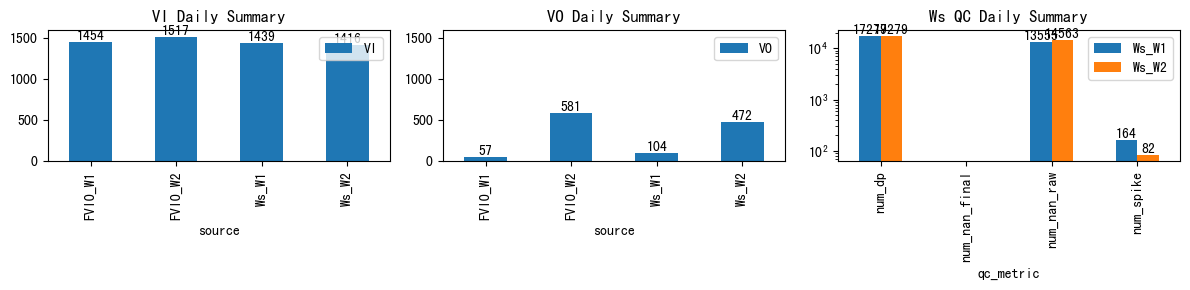
| ws_name | num_dp | num_nan_raw | num_nan_final | num_spike | cum_step_adj |
|---|---|---|---|---|---|
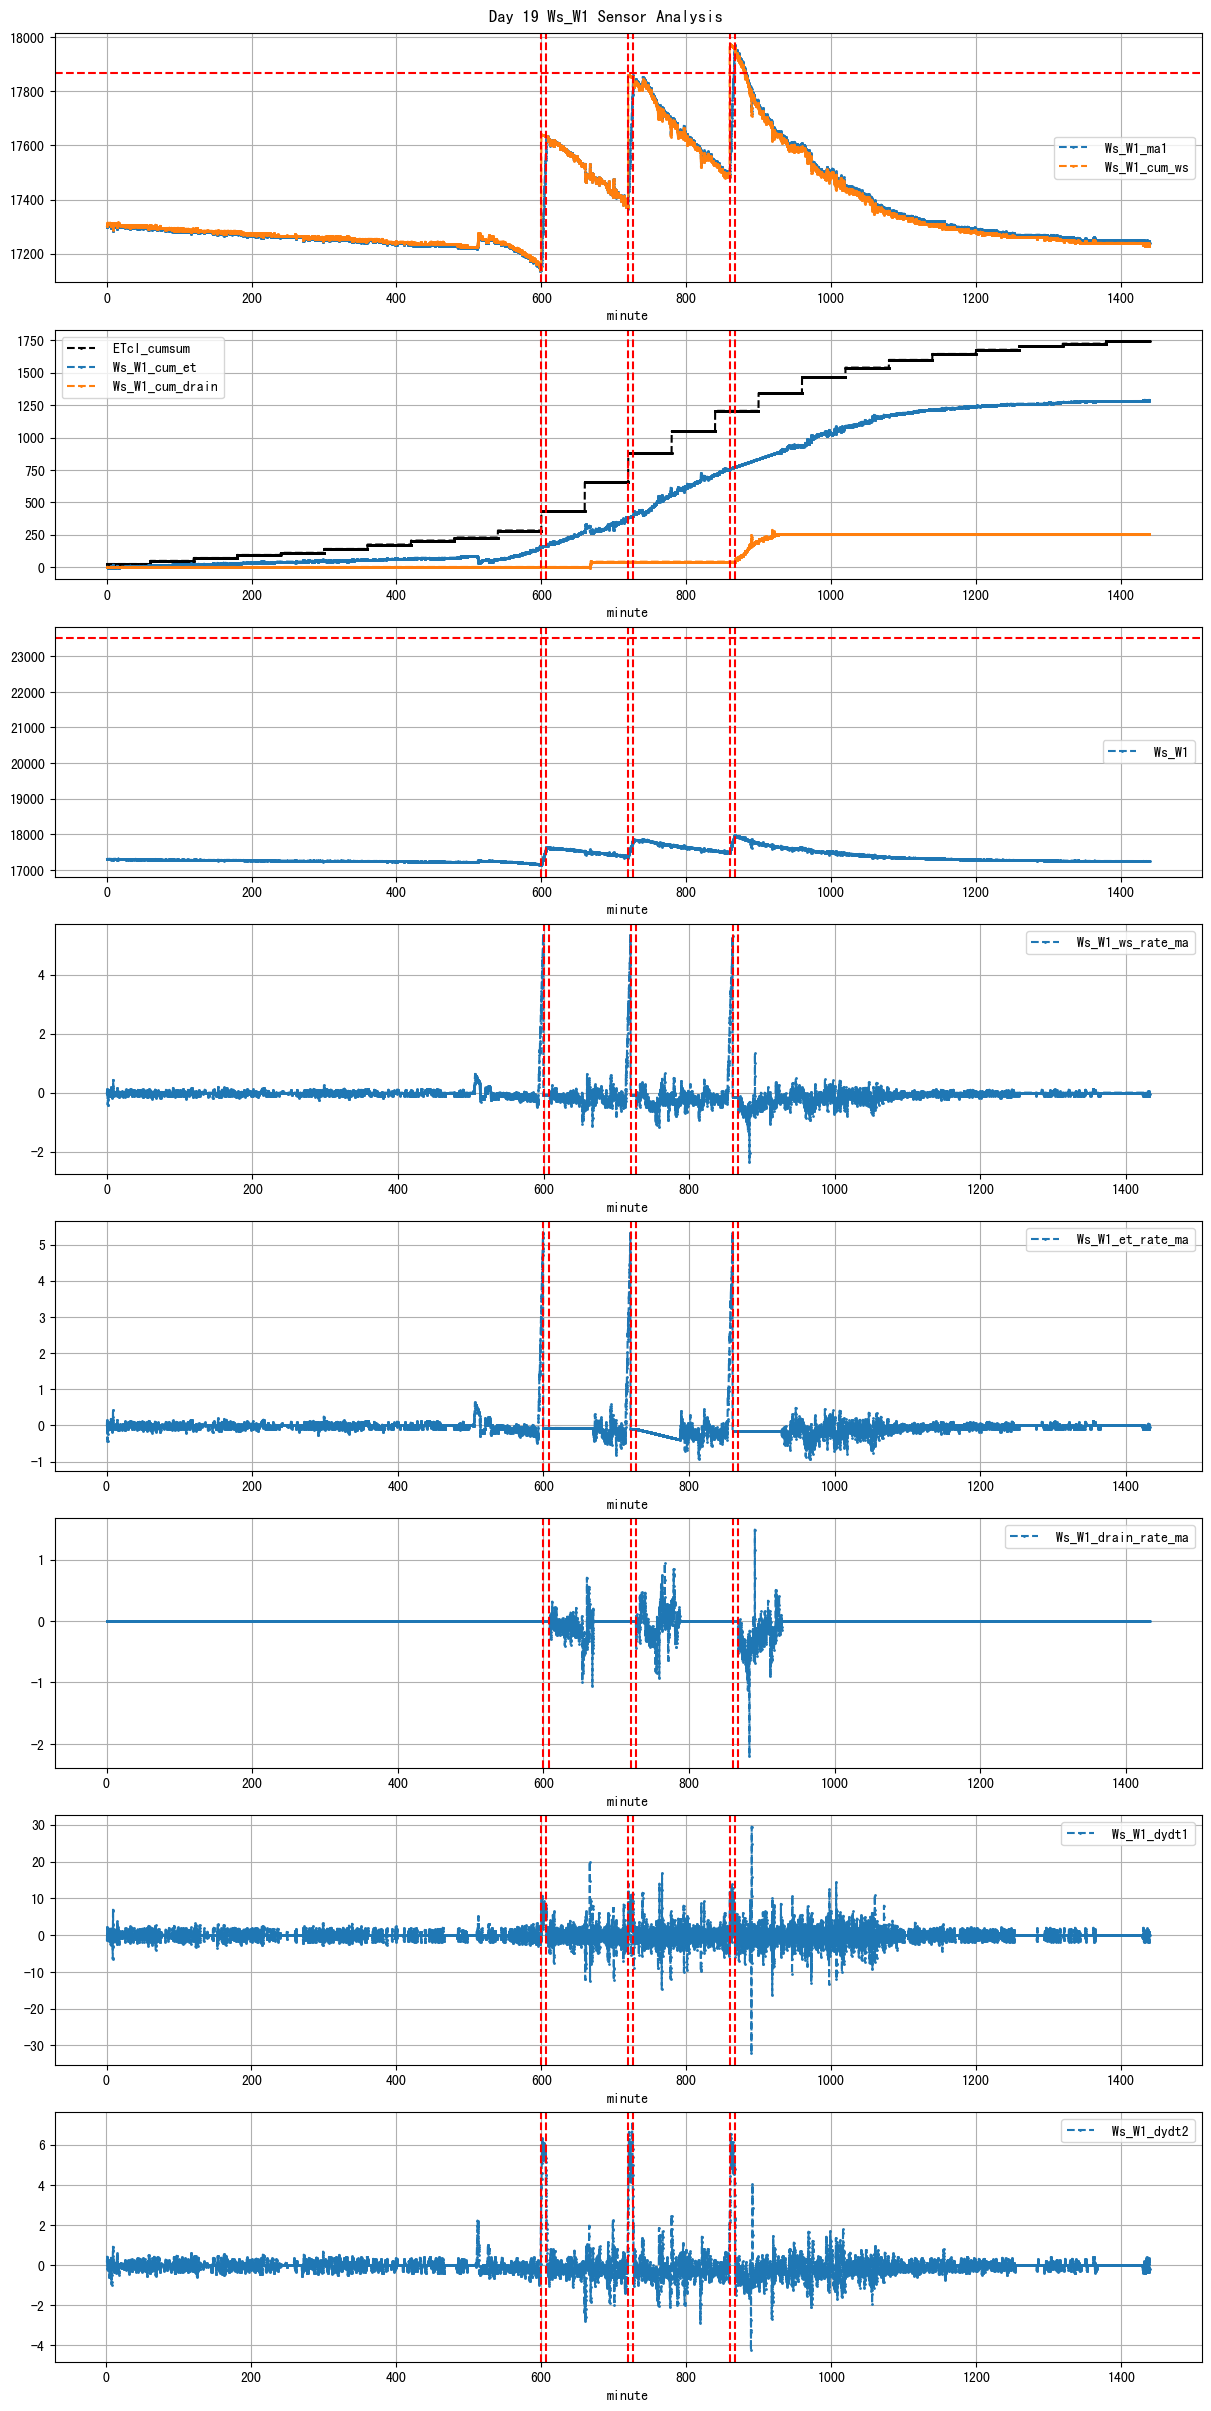
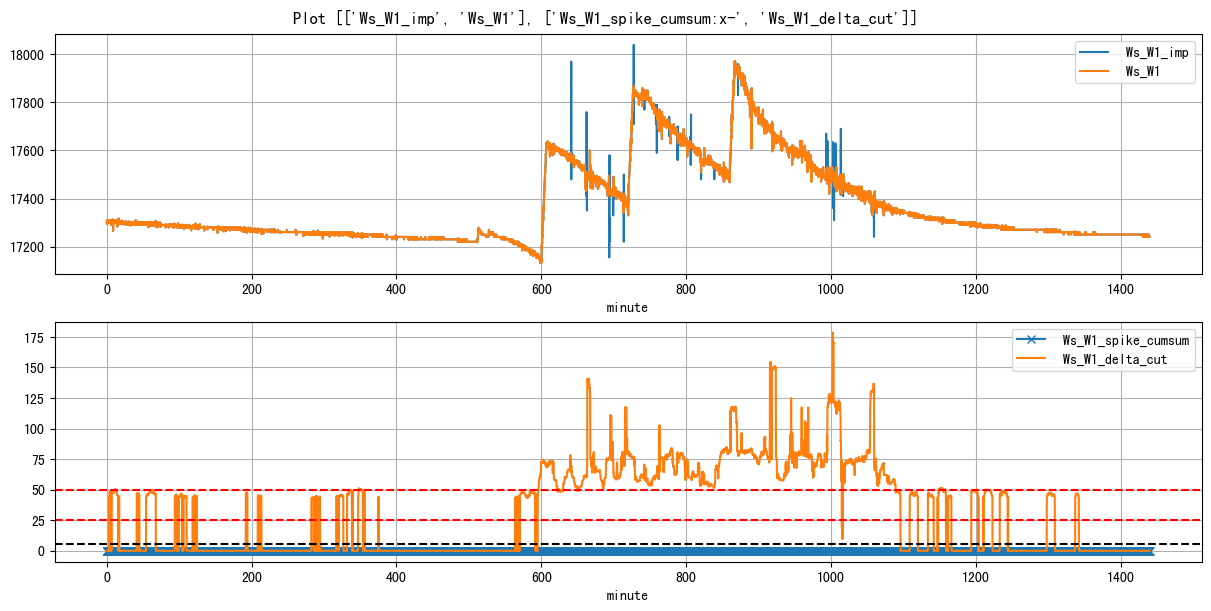
| Ws_W1 | 17,279 | 13,555 | 0 | 164 | 0.00 |
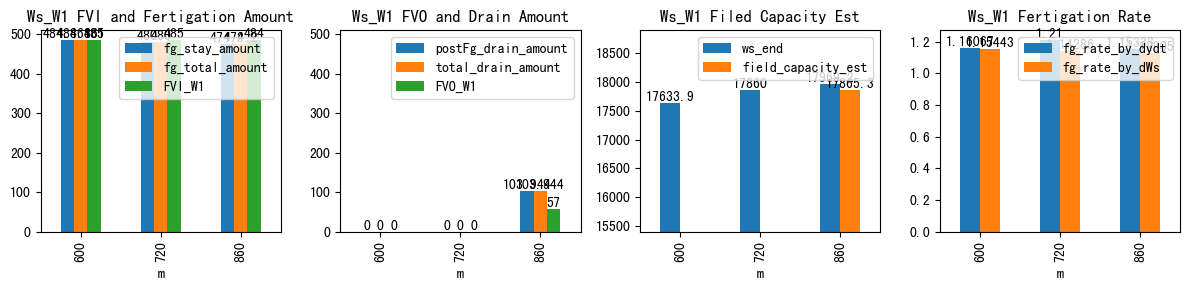
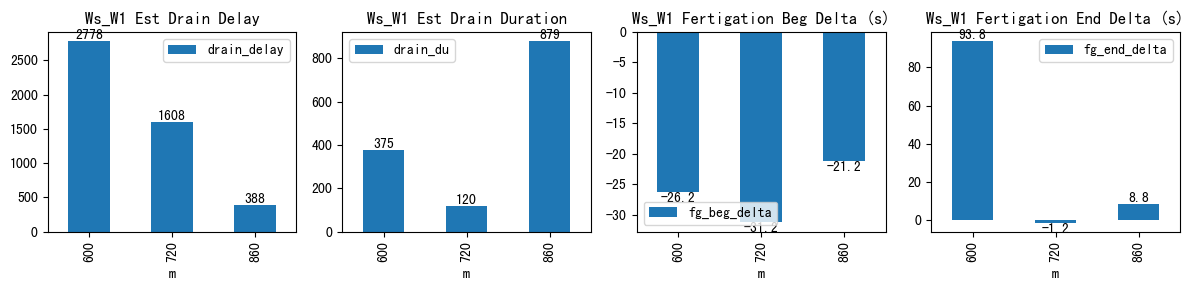
| ds | d | m | ws_name | prominence_cut | max_drain_du | fg_beg | fg_beg_est | fg_end | fg_end_est | ws_beg | ws_end | duc | pre_fg_et | post_fg_ws | post_drn_et | fg_rate_by_dydt | fg_rate_by_dWs | fg_stay_amount | enough_data | fg_beg_delta | fg_end_delta | fg_total_amount | fg_drain_amount | postFg_drain_amount | total_drain_amount | drain_du | drain_delay | drain_rate | field_capacity_est | FVI_W1 | FVO_W1 | FVI_W2 | FVO_W2 |
|---|---|---|---|---|---|---|---|---|---|---|---|---|---|---|---|---|---|---|---|---|---|---|---|---|---|---|---|---|---|---|---|---|---|
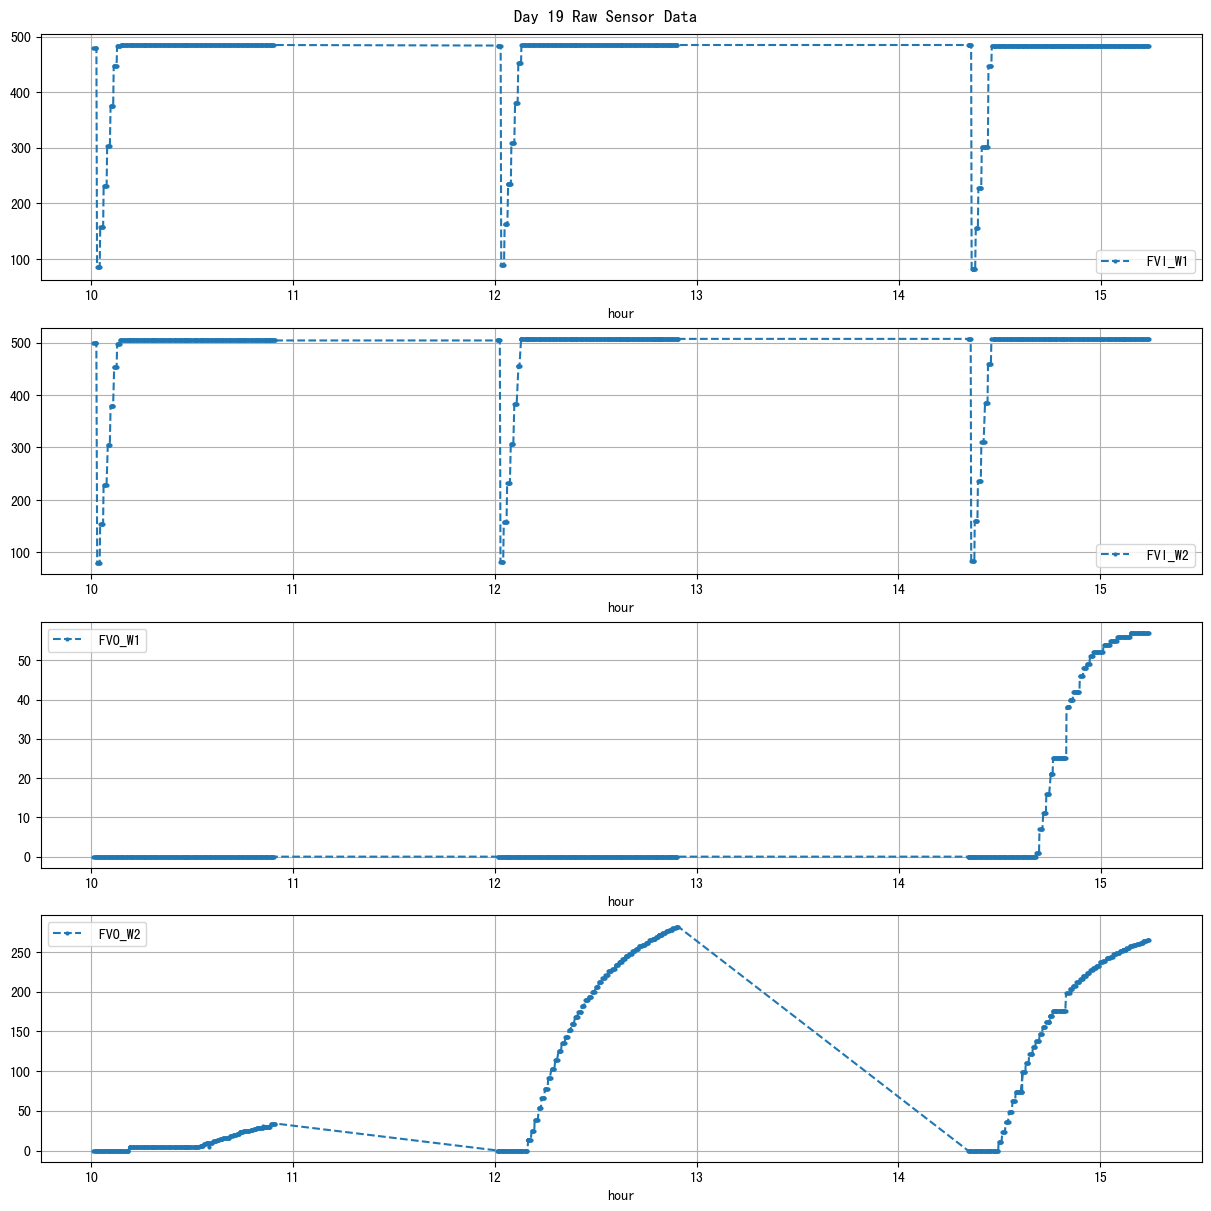
| 2026-03-20 10:00:01+08:00 | 19 | 600 | Ws_W1 | 1.472717 | 60 | 600.02 | 599.583333 | 607.02 | 608.583333 | 17149.055556 | 17633.916667 | 420 | -0.210362 | -0.067773 | -0.081481 | 1.160667 | 1.154431 | 484.861111 | True | -26.2 | 93.8 | 484.861111 | 0.0 | 0.000000 | 0.000000 | 375 | 2778 | -0.438224 | NaN | 485.0 | 0.0 | NaN | NaN |
| 2026-03-20 12:00:01+08:00 | 19 | 720 | Ws_W1 | 1.472717 | 60 | 720.02 | 719.500000 | 727.02 | 727.000000 | 17380.000000 | 17860.000000 | 420 | -0.243472 | -0.096296 | -0.388457 | 1.210000 | 1.142857 | 480.000000 | True | -31.2 | -1.2 | 480.000000 | 0.0 | 0.000000 | 0.000000 | 120 | 1608 | -0.526083 | NaN | 485.0 | 0.0 | NaN | NaN |
| 2026-03-20 14:20:01+08:00 | 19 | 860 | Ws_W1 | 1.472717 | 60 | 860.02 | 859.666667 | 867.02 | 867.166667 | 17495.000000 | 17969.200000 | 420 | -0.159384 | -0.484671 | -0.155556 | 1.153333 | 1.129048 | 474.200000 | True | -21.2 | 8.8 | 474.200000 | 0.0 | 103.943583 | 103.943583 | 879 | 388 | -0.657067 | 17865.256417 | 484.0 | 57.0 | NaN | NaN |
| ws_name | num_dp | num_nan_raw | num_nan_final | num_spike | cum_step_adj |
|---|---|---|---|---|---|
| Ws_W2 | 17,279 | 14,563 | 0 | 82 | -57.08 |
| ds | d | m | ws_name | prominence_cut | max_drain_du | fg_beg | fg_beg_est | fg_end | fg_end_est | ws_beg | ws_end | duc | pre_fg_et | post_fg_ws | post_drn_et | fg_rate_by_dydt | fg_rate_by_dWs | fg_stay_amount | enough_data | fg_beg_delta | fg_end_delta | fg_total_amount | fg_drain_amount | postFg_drain_amount | total_drain_amount | drain_du | drain_delay | drain_rate | field_capacity_est | FVI_W1 | FVO_W1 | FVI_W2 | FVO_W2 |
|---|---|---|---|---|---|---|---|---|---|---|---|---|---|---|---|---|---|---|---|---|---|---|---|---|---|---|---|---|---|---|---|---|---|
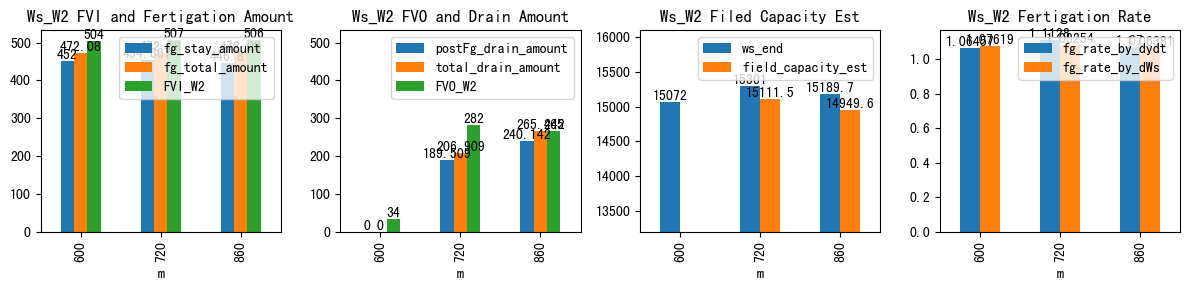
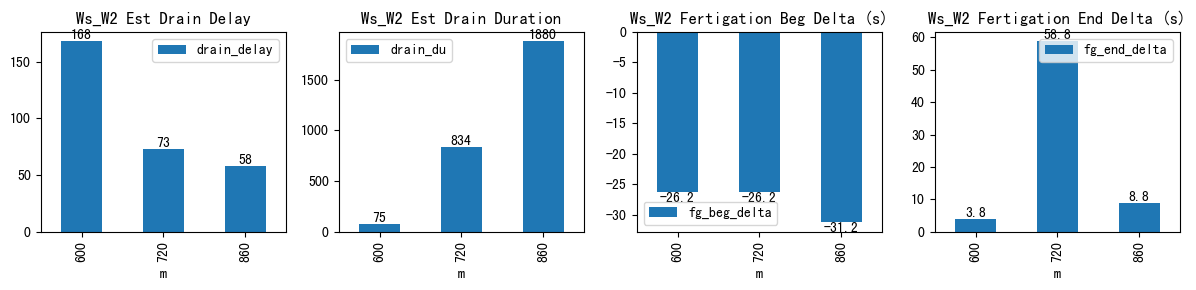
| 2026-03-20 10:00:01+08:00 | 19 | 600 | Ws_W2 | 1.310038 | 60 | 600.02 | 599.583333 | 607.02 | 607.083333 | 14620.000000 | 15072.000000 | 420 | -0.092447 | -0.177778 | -0.184664 | 1.064571 | 1.07619 | 452.000000 | True | -26.2 | 3.8 | 472.08 | 0.0 | 0.000000 | 0.000000 | 75 | 168 | -0.222386 | NaN | NaN | NaN | 504.0 | 34.0 |
| 2026-03-20 12:00:01+08:00 | 19 | 720 | Ws_W2 | 1.310038 | 60 | 720.02 | 719.583333 | 727.02 | 728.000000 | 14846.333333 | 15301.000000 | 420 | -0.083087 | -1.080864 | -0.717978 | 1.112800 | 1.08254 | 454.666667 | True | -26.2 | 58.8 | 472.08 | 17.4 | 189.509274 | 206.909274 | 834 | 73 | -1.026839 | 15111.490726 | NaN | NaN | 507.0 | 282.0 |
| 2026-03-20 14:20:01+08:00 | 19 | 860 | Ws_W2 | 1.310038 | 60 | 860.02 | 859.500000 | 867.02 | 867.166667 | 14742.916667 | 15189.716667 | 420 | -0.056232 | -0.986420 | -0.224712 | 1.070000 | 1.06381 | 446.800000 | True | -31.2 | 8.8 | 472.08 | 25.3 | 240.142475 | 265.442475 | 1880 | 58 | -0.953835 | 14949.574192 | NaN | NaN | 506.0 | 265.0 |