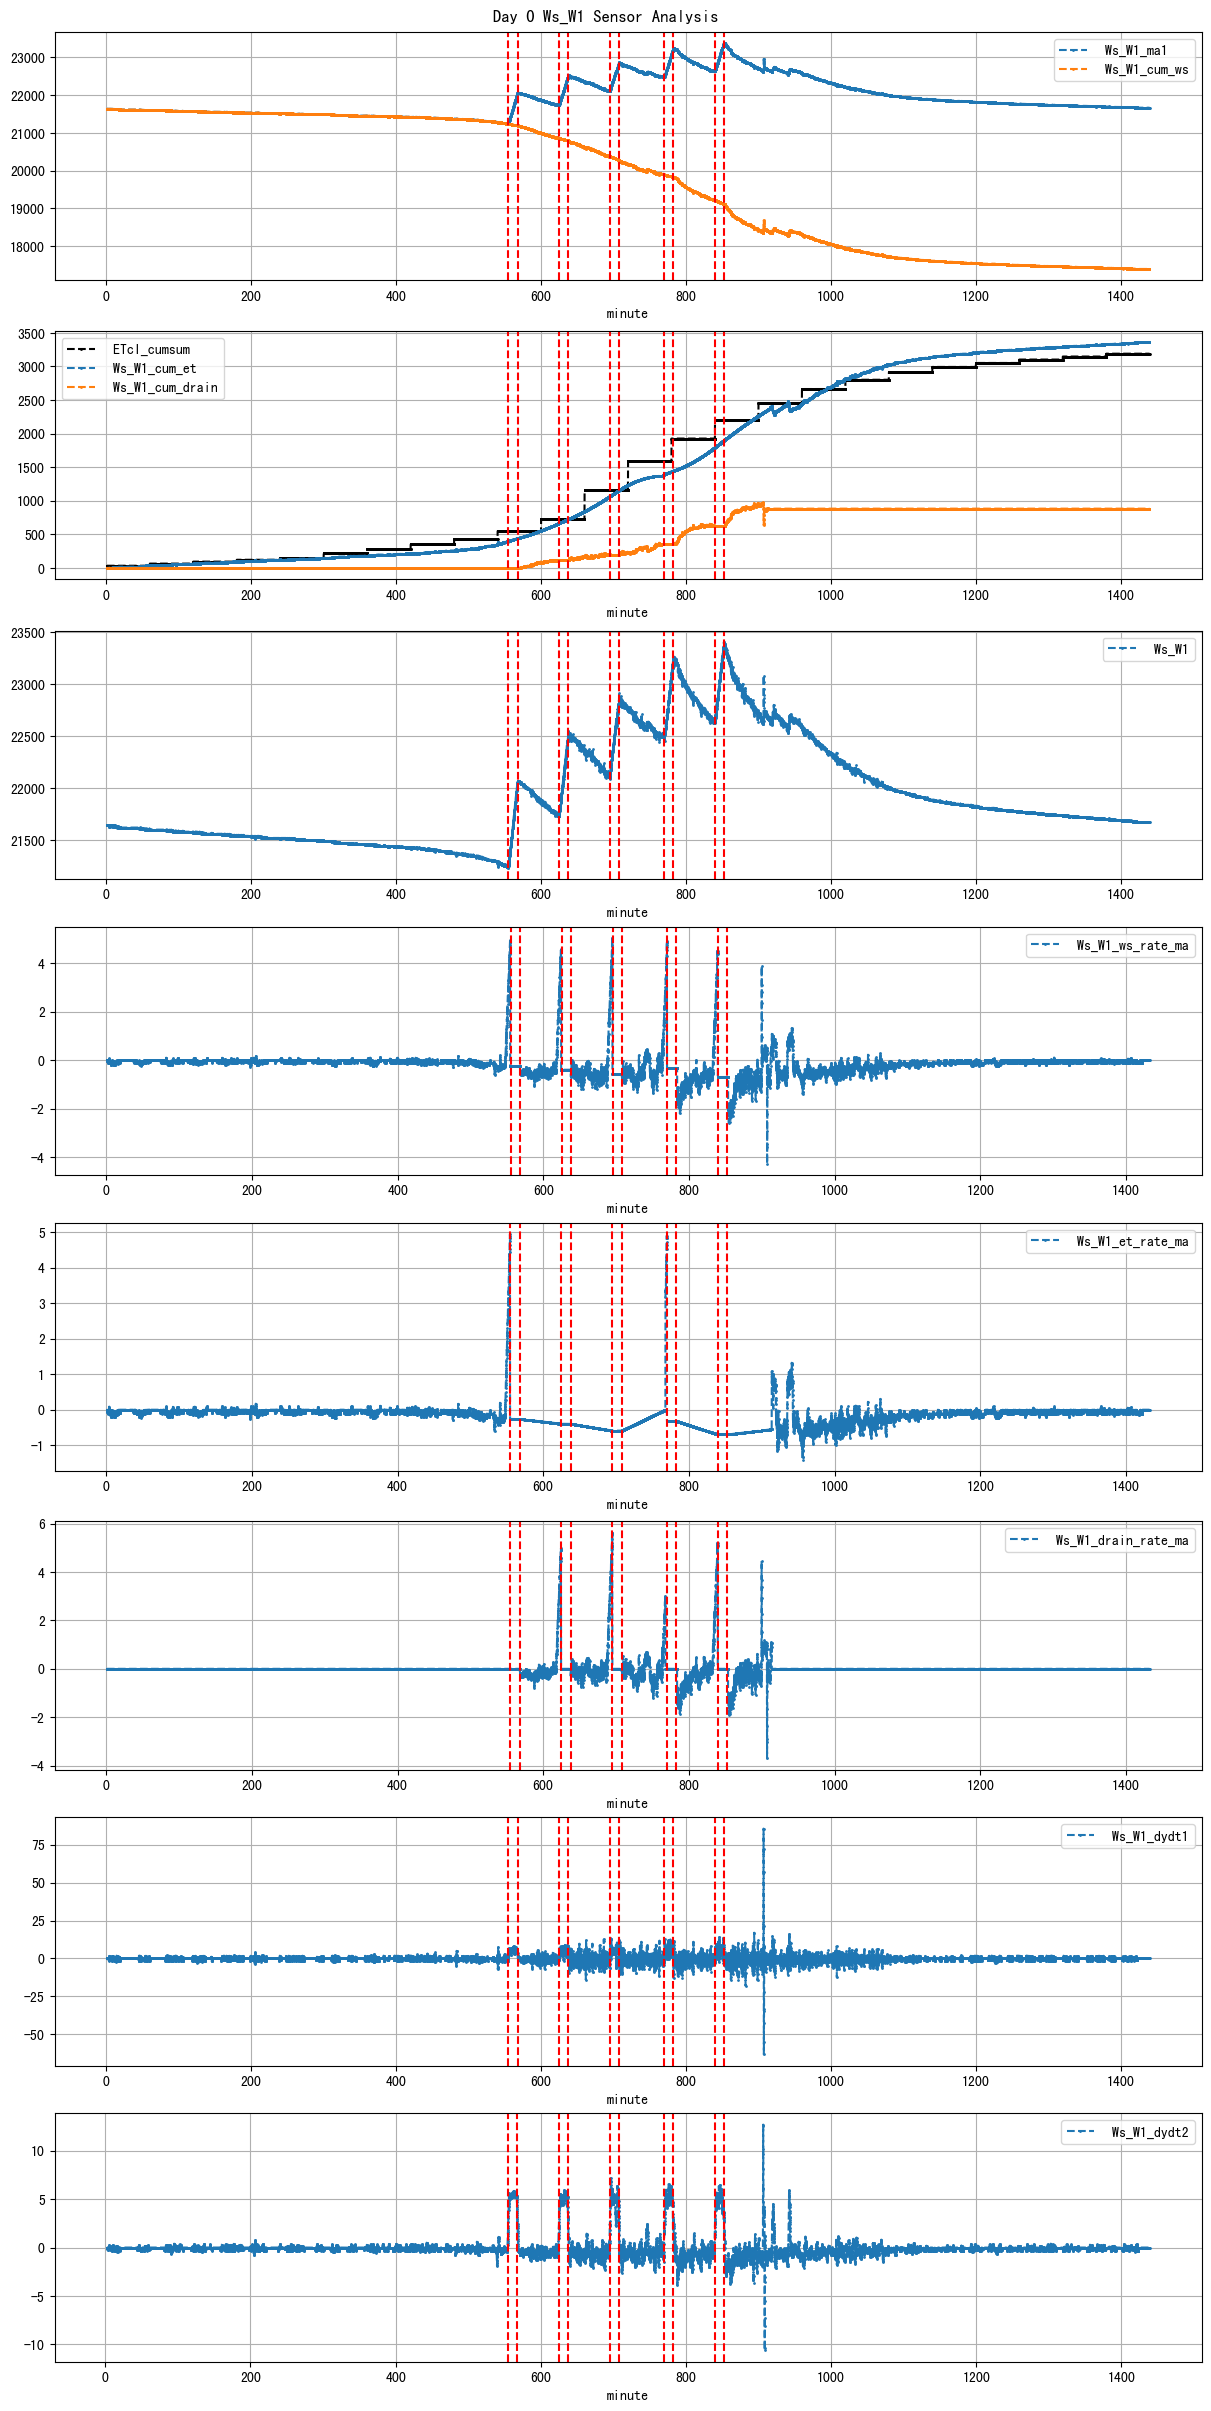
VI and VO Daily Summary
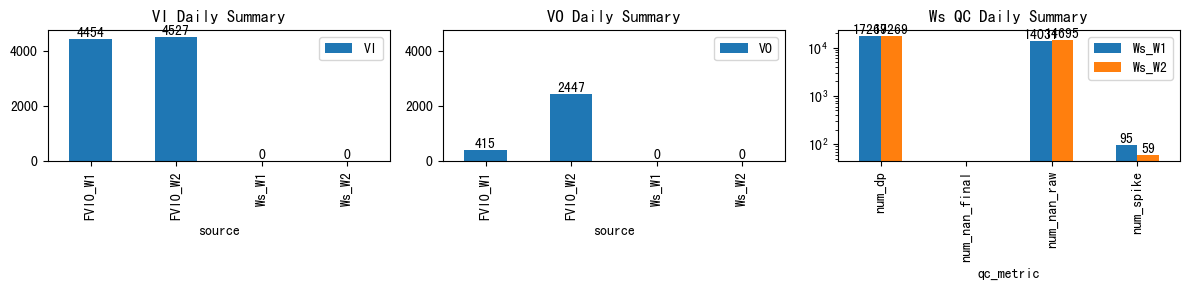
| ws_name | num_dp | num_nan_raw | num_nan_final | num_spike | cum_step_adj |
|---|---|---|---|---|---|
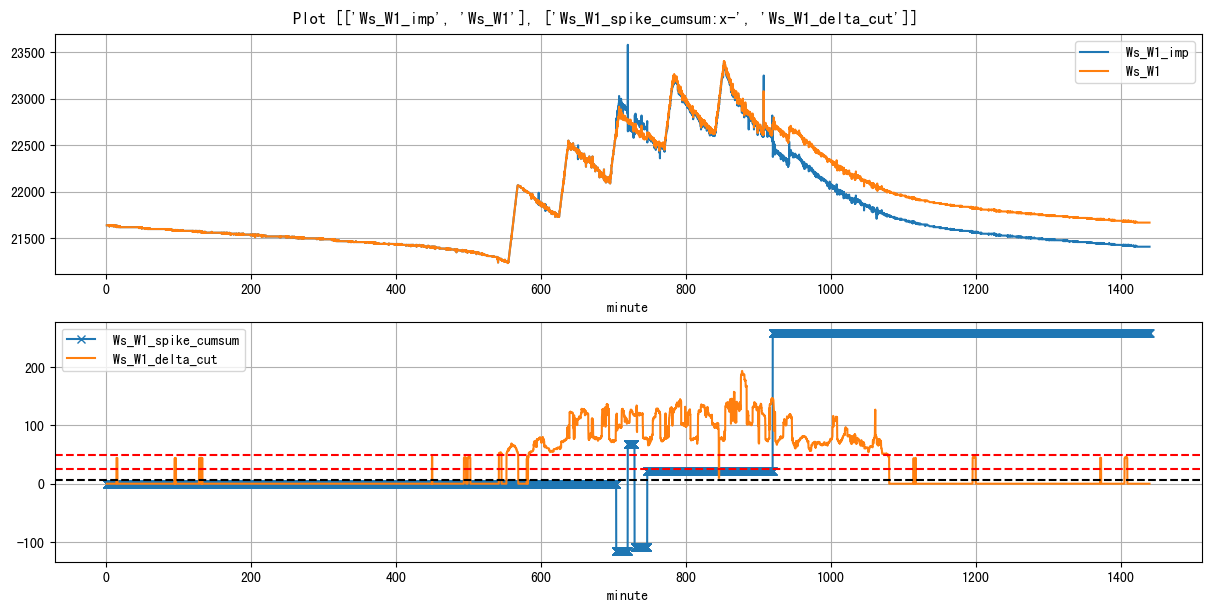
| Ws_W1 | 17,269 | 14,031 | 0 | 95 | 259.17 |
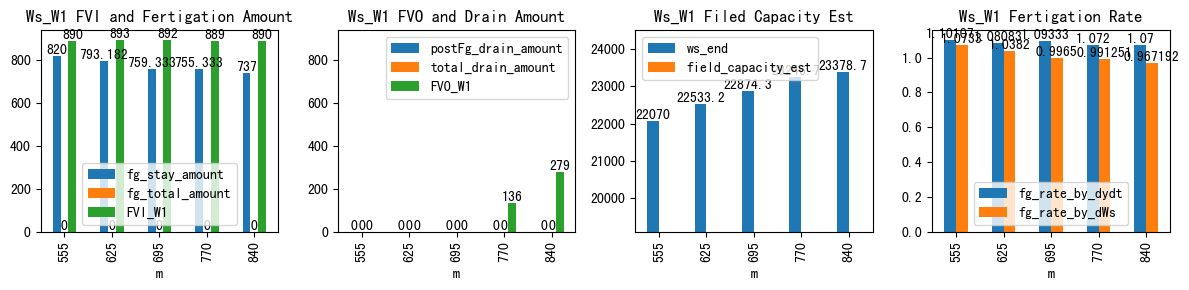
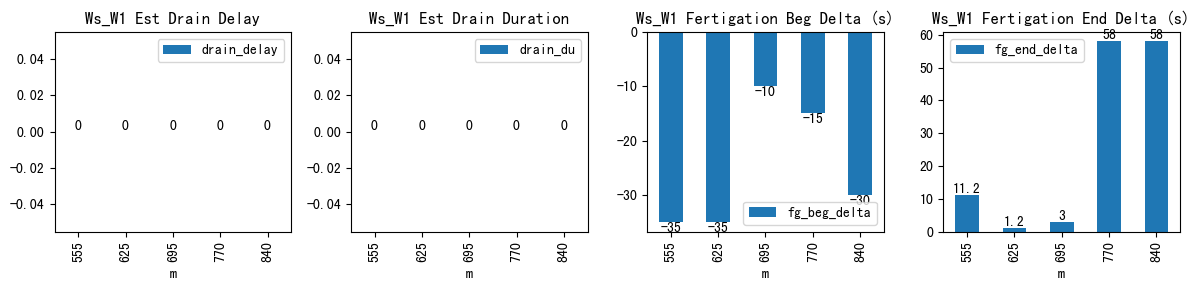
| ds | d | m | ws_name | prominence_cut | max_drain_du | fg_beg | fg_beg_est | fg_end | fg_end_est | ws_beg | ws_end | duc | pre_fg_et | post_fg_ws | post_drn_et | fg_rate_by_dydt | fg_rate_by_dWs | fg_stay_amount | enough_data | fg_beg_delta | fg_end_delta | fg_total_amount | fg_drain_amount | postFg_drain_amount | total_drain_amount | drain_du | drain_delay | drain_rate | field_capacity_est | FVI_W1 | FVO_W1 | FVI_W2 | FVO_W2 |
|---|---|---|---|---|---|---|---|---|---|---|---|---|---|---|---|---|---|---|---|---|---|---|---|---|---|---|---|---|---|---|---|---|---|
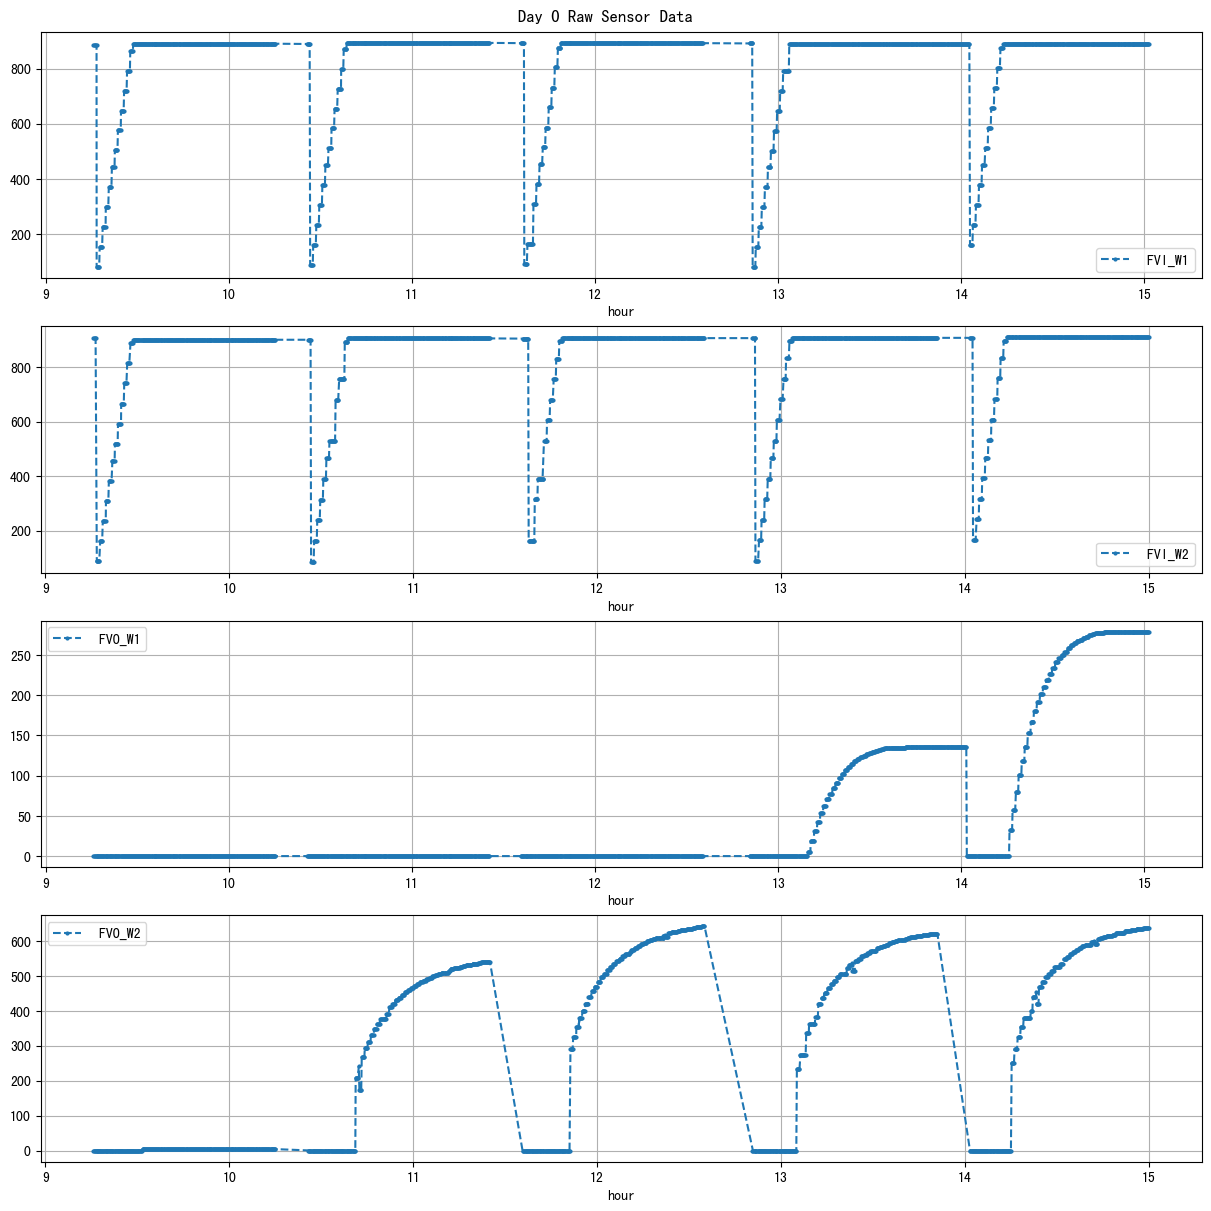
| 2026-03-01 09:15:00+08:00 | 0 | 555 | Ws_W1 | 2.366721 | 57.083333 | 555.0 | 554.416667 | 567.73 | 567.916667 | 21250.000000 | 22070.000000 | 764 | -0.260051 | -0.484722 | 0.000000 | 1.101067 | 1.073298 | 820.000000 | True | -35.0 | 11.2 | NaN | 0.0 | 0.0 | 0.0 | NaN | NaN | NaN | NaN | 890.0 | 0.0 | NaN | NaN |
| 2026-03-01 10:25:00+08:00 | 0 | 625 | Ws_W1 | 2.366721 | 57.250000 | 625.0 | 624.416667 | 637.73 | 637.750000 | 21740.000000 | 22533.181818 | 764 | -0.396921 | -0.504630 | 0.000000 | 1.080833 | 1.038196 | 793.181818 | True | -35.0 | 1.2 | NaN | 0.0 | 0.0 | 0.0 | NaN | NaN | NaN | NaN | 893.0 | 0.0 | NaN | NaN |
| 2026-03-01 11:35:00+08:00 | 0 | 695 | Ws_W1 | 2.366721 | 60.000000 | 695.0 | 694.833333 | 707.70 | 707.750000 | 22115.000000 | 22874.333333 | 762 | -0.671921 | -0.591152 | 0.000000 | 1.093333 | 0.996500 | 759.333333 | True | -10.0 | 3.0 | NaN | 0.0 | 0.0 | 0.0 | NaN | NaN | NaN | NaN | 892.0 | 0.0 | NaN | NaN |
| 2026-03-01 12:50:00+08:00 | 0 | 770 | Ws_W1 | 2.366721 | 56.333333 | 770.0 | 769.750000 | 782.70 | 783.666667 | 22491.333333 | 23246.666667 | 762 | -0.325479 | -1.528704 | 0.000000 | 1.072000 | 0.991251 | 755.333333 | True | -15.0 | 58.0 | NaN | 0.0 | 0.0 | 0.0 | NaN | NaN | NaN | NaN | 889.0 | 136.0 | NaN | NaN |
| 2026-03-01 14:00:00+08:00 | 0 | 840 | Ws_W1 | 2.366721 | 60.000000 | 840.0 | 839.500000 | 852.70 | 853.666667 | 22641.666667 | 23378.666667 | 762 | -0.696409 | -2.005556 | -0.551235 | 1.070000 | 0.967192 | 737.000000 | True | -30.0 | 58.0 | NaN | 0.0 | 0.0 | 0.0 | NaN | NaN | NaN | NaN | 890.0 | 279.0 | NaN | NaN |
| ws_name | num_dp | num_nan_raw | num_nan_final | num_spike | cum_step_adj |
|---|---|---|---|---|---|
| Ws_W2 | 17,269 | 14,695 | 0 | 59 | -98.33 |
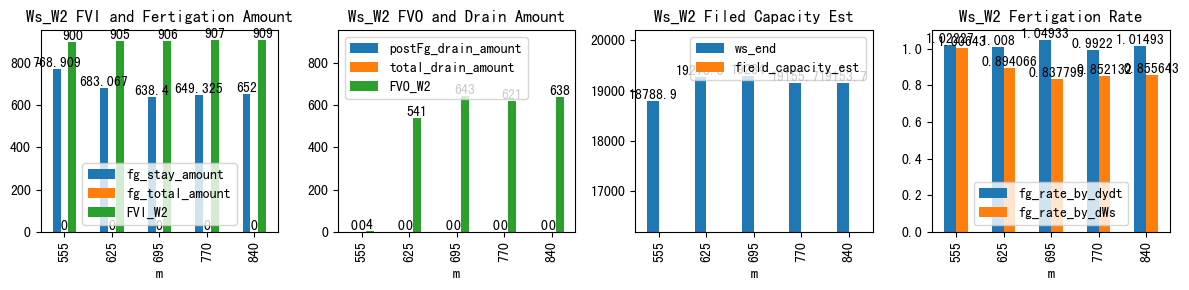
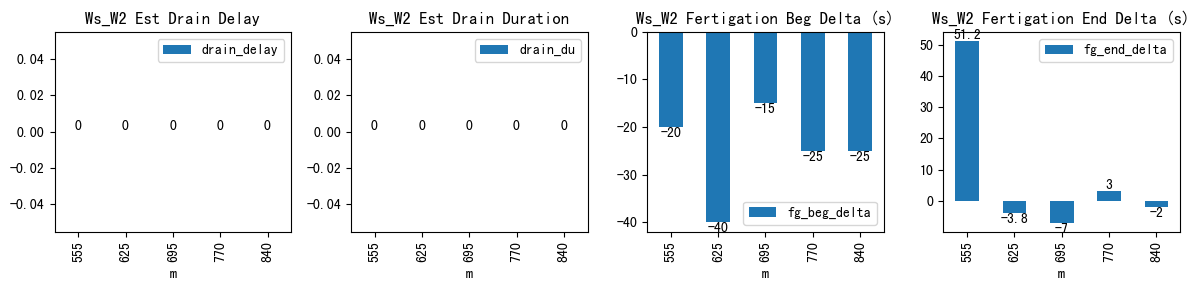
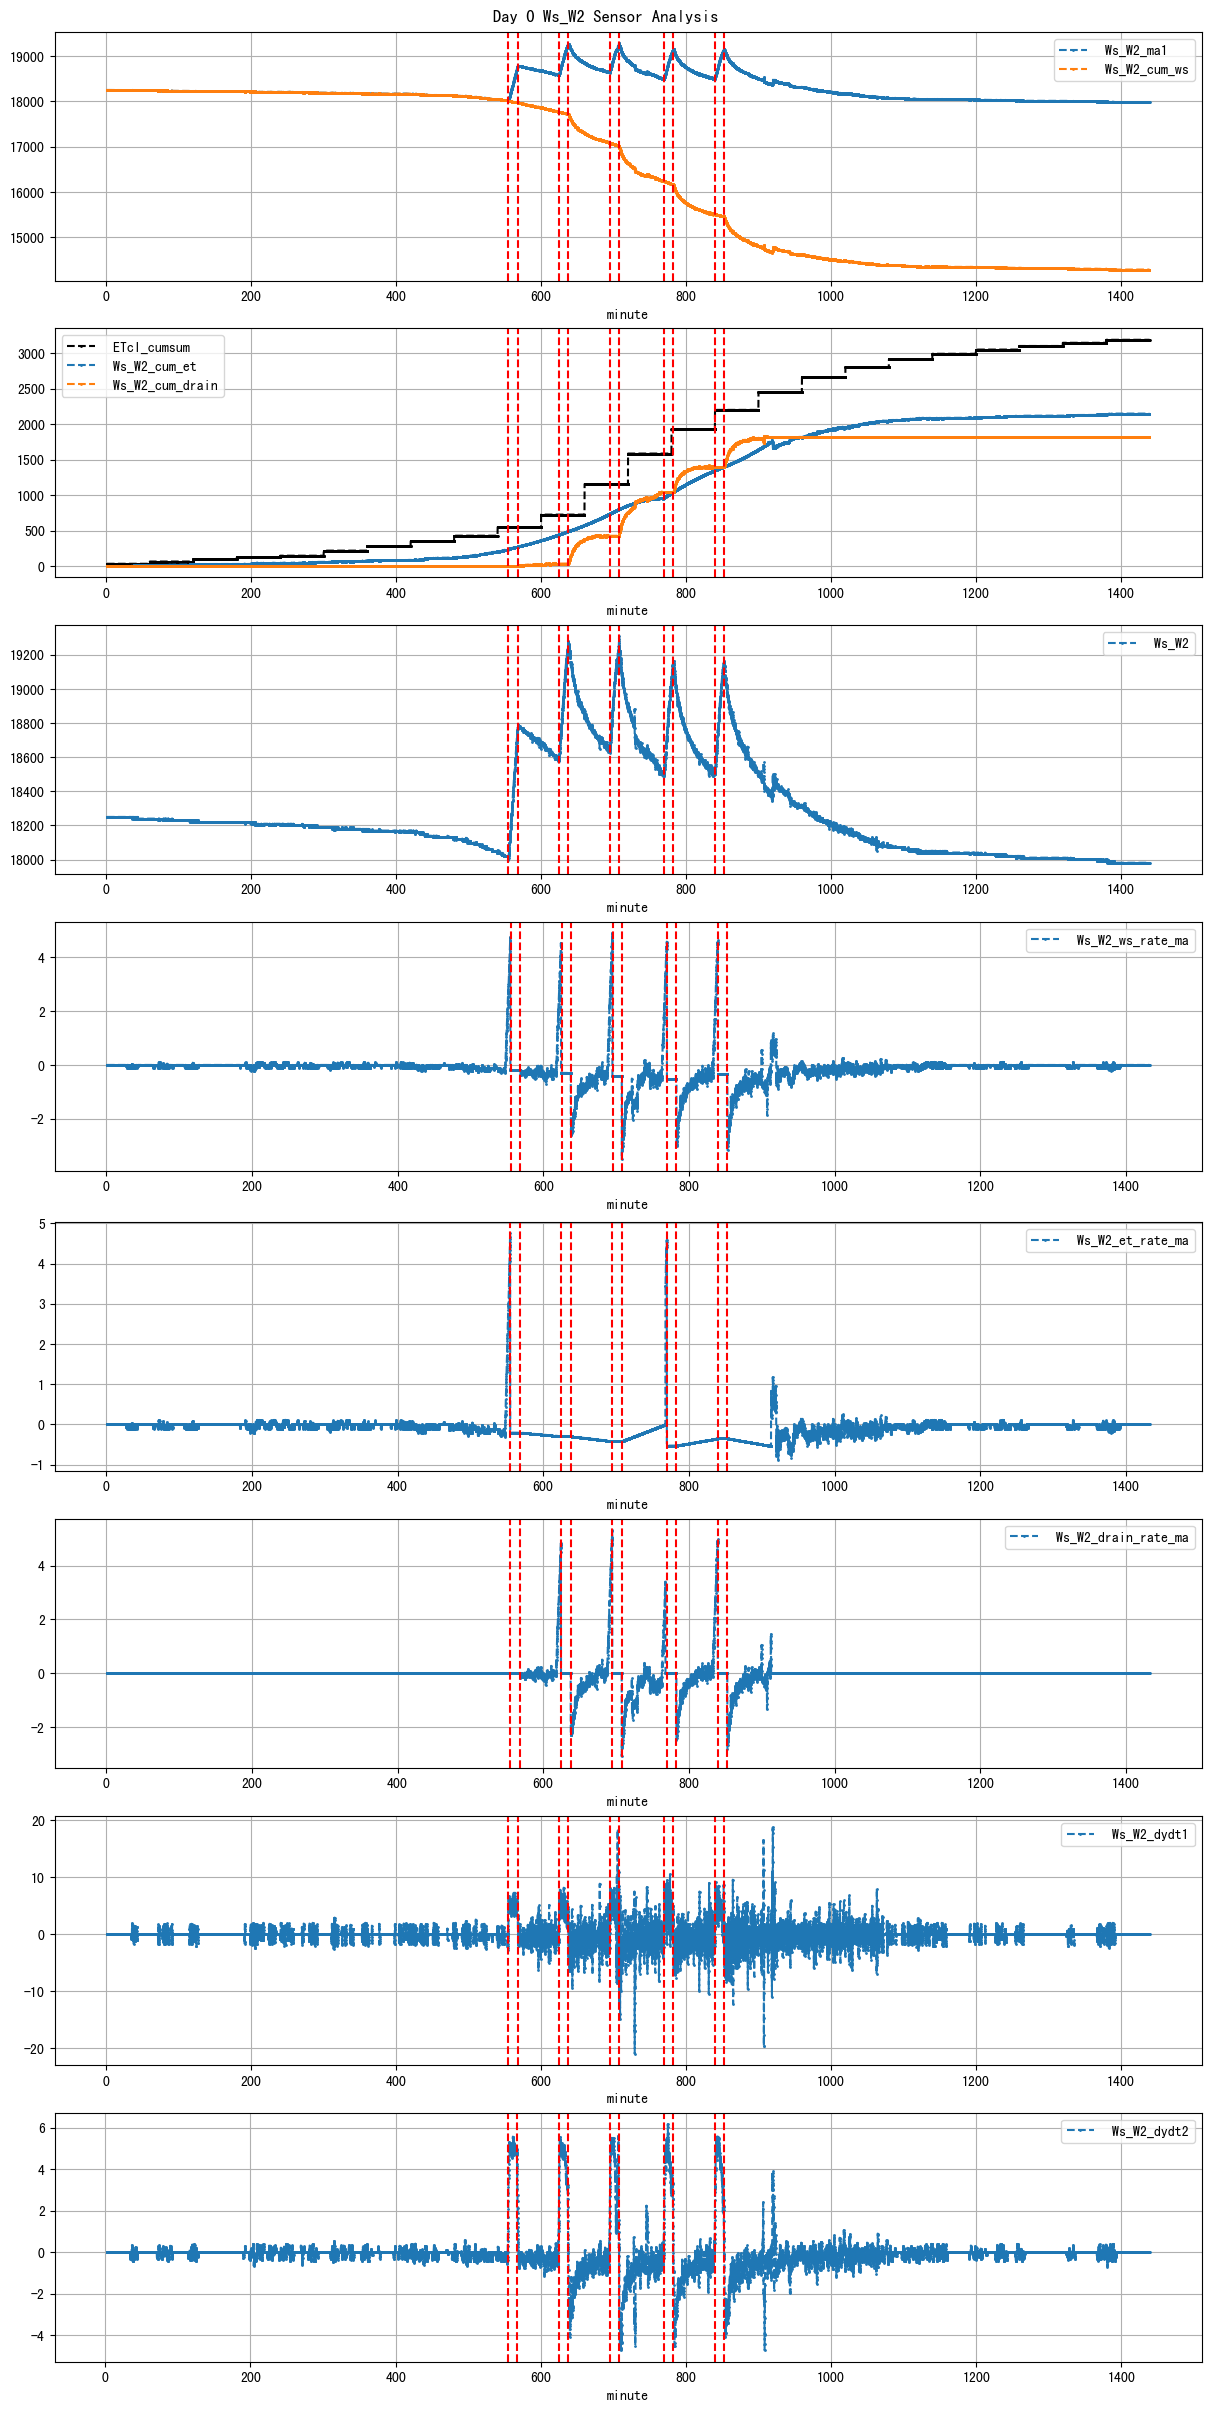
| ds | d | m | ws_name | prominence_cut | max_drain_du | fg_beg | fg_beg_est | fg_end | fg_end_est | ws_beg | ws_end | duc | pre_fg_et | post_fg_ws | post_drn_et | fg_rate_by_dydt | fg_rate_by_dWs | fg_stay_amount | enough_data | fg_beg_delta | fg_end_delta | fg_total_amount | fg_drain_amount | postFg_drain_amount | total_drain_amount | drain_du | drain_delay | drain_rate | field_capacity_est | FVI_W1 | FVO_W1 | FVI_W2 | FVO_W2 |
|---|---|---|---|---|---|---|---|---|---|---|---|---|---|---|---|---|---|---|---|---|---|---|---|---|---|---|---|---|---|---|---|---|---|
| 2026-03-01 09:15:00+08:00 | 0 | 555 | Ws_W2 | 2.728152 | 56.416667 | 555.0 | 554.666667 | 567.73 | 568.583333 | 18020.000000 | 18788.909091 | 764 | -0.204922 | -0.305496 | 0.000000 | 1.022267 | 1.006426 | 768.909091 | True | -20.0 | 51.2 | NaN | 0.0 | 0.0 | 0.0 | NaN | NaN | NaN | NaN | NaN | NaN | 900.0 | 4.0 |
| 2026-03-01 10:25:00+08:00 | 0 | 625 | Ws_W2 | 2.728152 | 57.270000 | 625.0 | 624.333333 | 637.73 | 637.666667 | 18590.433333 | 19273.500000 | 764 | -0.297099 | -1.920165 | 0.000000 | 1.008000 | 0.894066 | 683.066667 | True | -40.0 | -3.8 | NaN | 0.0 | 0.0 | 0.0 | NaN | NaN | NaN | NaN | NaN | NaN | 905.0 | 541.0 |
| 2026-03-01 11:35:00+08:00 | 0 | 695 | Ws_W2 | 2.728152 | 60.000000 | 695.0 | 694.750000 | 707.70 | 707.583333 | 18645.600000 | 19284.000000 | 762 | -0.420100 | -2.082531 | 0.000000 | 1.049333 | 0.837795 | 638.400000 | True | -15.0 | -7.0 | NaN | 0.0 | 0.0 | 0.0 | NaN | NaN | NaN | NaN | NaN | NaN | 906.0 | 643.0 |
| 2026-03-01 12:50:00+08:00 | 0 | 770 | Ws_W2 | 2.728152 | 57.250000 | 770.0 | 769.583333 | 782.70 | 782.750000 | 18506.341991 | 19155.666667 | 762 | -0.528732 | -1.943915 | 0.000000 | 0.992200 | 0.852132 | 649.324675 | True | -25.0 | 3.0 | NaN | 0.0 | 0.0 | 0.0 | NaN | NaN | NaN | NaN | NaN | NaN | 907.0 | 621.0 |
| 2026-03-01 14:00:00+08:00 | 0 | 840 | Ws_W2 | 2.728152 | 60.000000 | 840.0 | 839.583333 | 852.70 | 852.666667 | 18501.666667 | 19153.666667 | 762 | -0.348439 | -1.986214 | -0.536214 | 1.014933 | 0.855643 | 652.000000 | True | -25.0 | -2.0 | NaN | 0.0 | 0.0 | 0.0 | NaN | NaN | NaN | NaN | NaN | NaN | 909.0 | 638.0 |