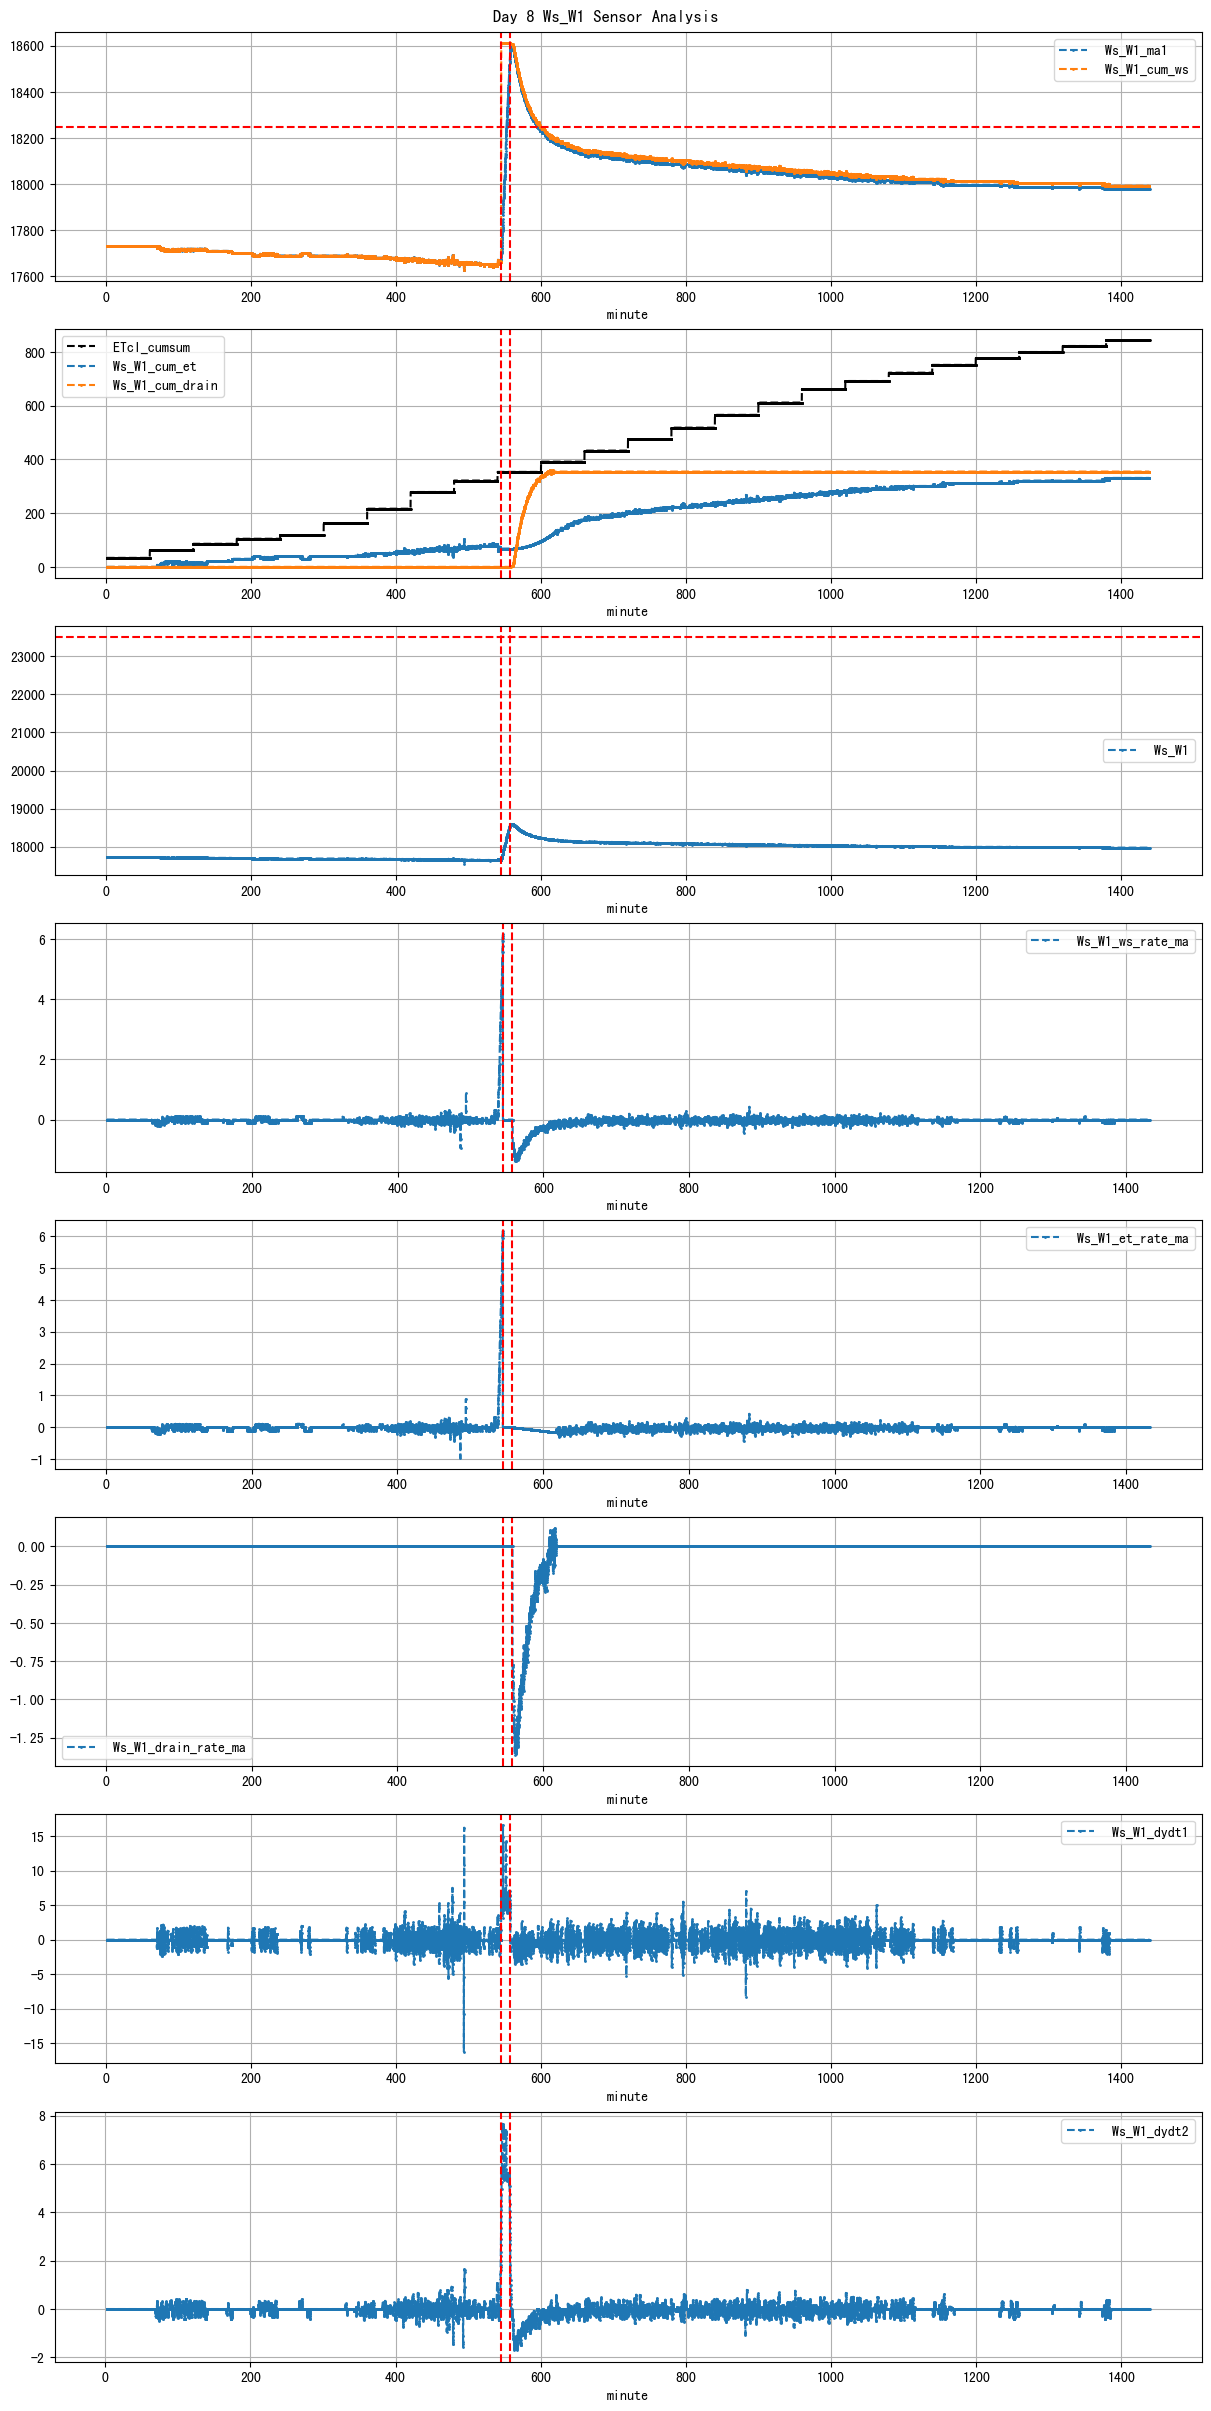
VI and VO Daily Summary
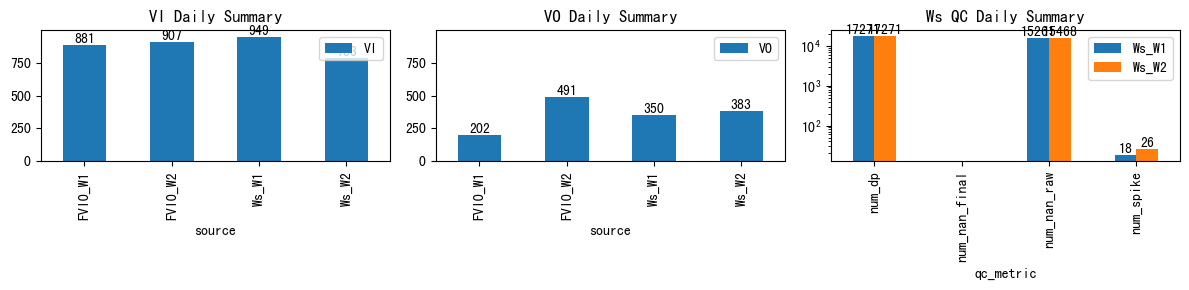
| ws_name | num_dp | num_nan_raw | num_nan_final | num_spike | cum_step_adj |
|---|---|---|---|---|---|
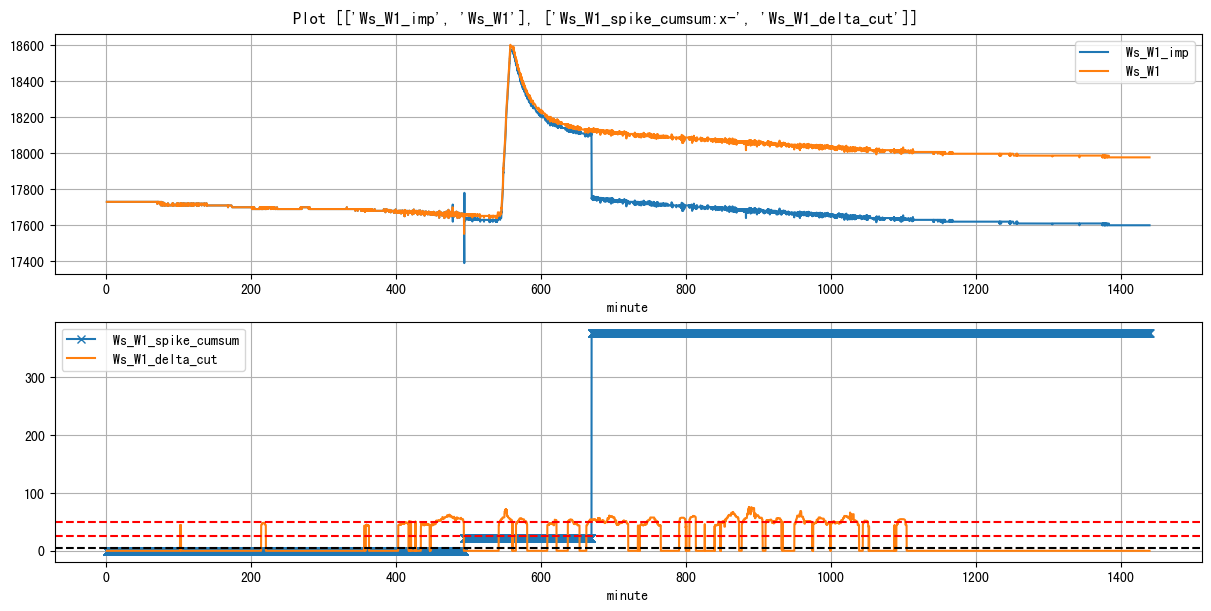
| Ws_W1 | 17,271 | 15,261 | 0 | 18 | 377.00 |
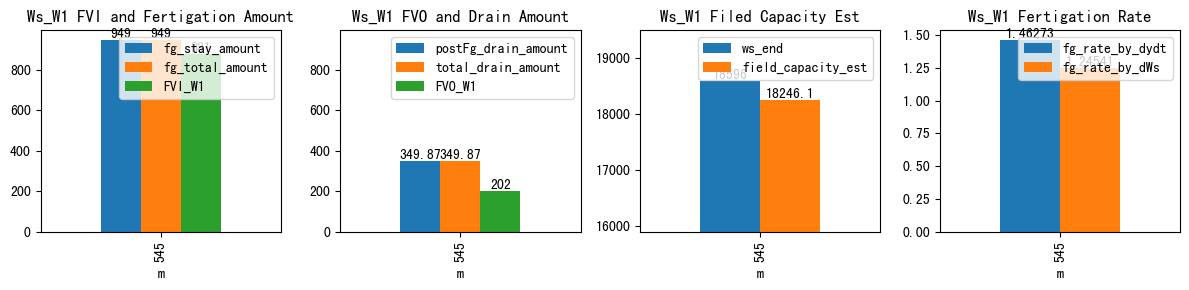
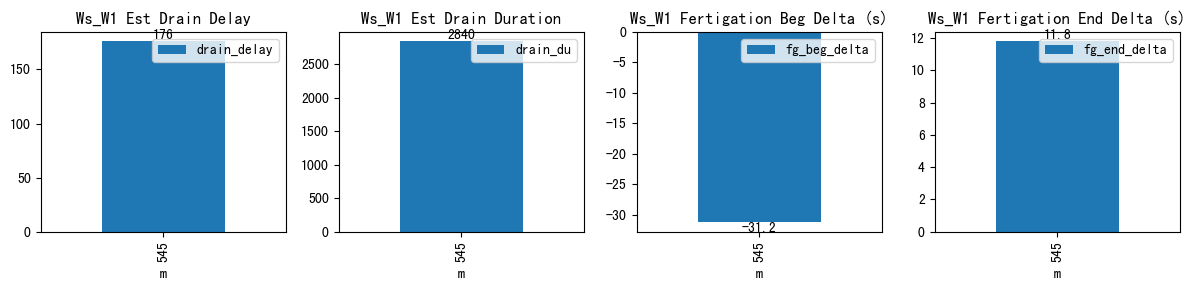
| ds | d | m | ws_name | prominence_cut | max_drain_du | fg_beg | fg_beg_est | fg_end | fg_end_est | ws_beg | ws_end | duc | pre_fg_et | post_fg_ws | post_drn_et | fg_rate_by_dydt | fg_rate_by_dWs | fg_stay_amount | enough_data | fg_beg_delta | fg_end_delta | fg_total_amount | fg_drain_amount | postFg_drain_amount | total_drain_amount | drain_du | drain_delay | drain_rate | field_capacity_est | FVI_W1 | FVO_W1 | FVI_W2 | FVO_W2 |
|---|---|---|---|---|---|---|---|---|---|---|---|---|---|---|---|---|---|---|---|---|---|---|---|---|---|---|---|---|---|---|---|---|---|
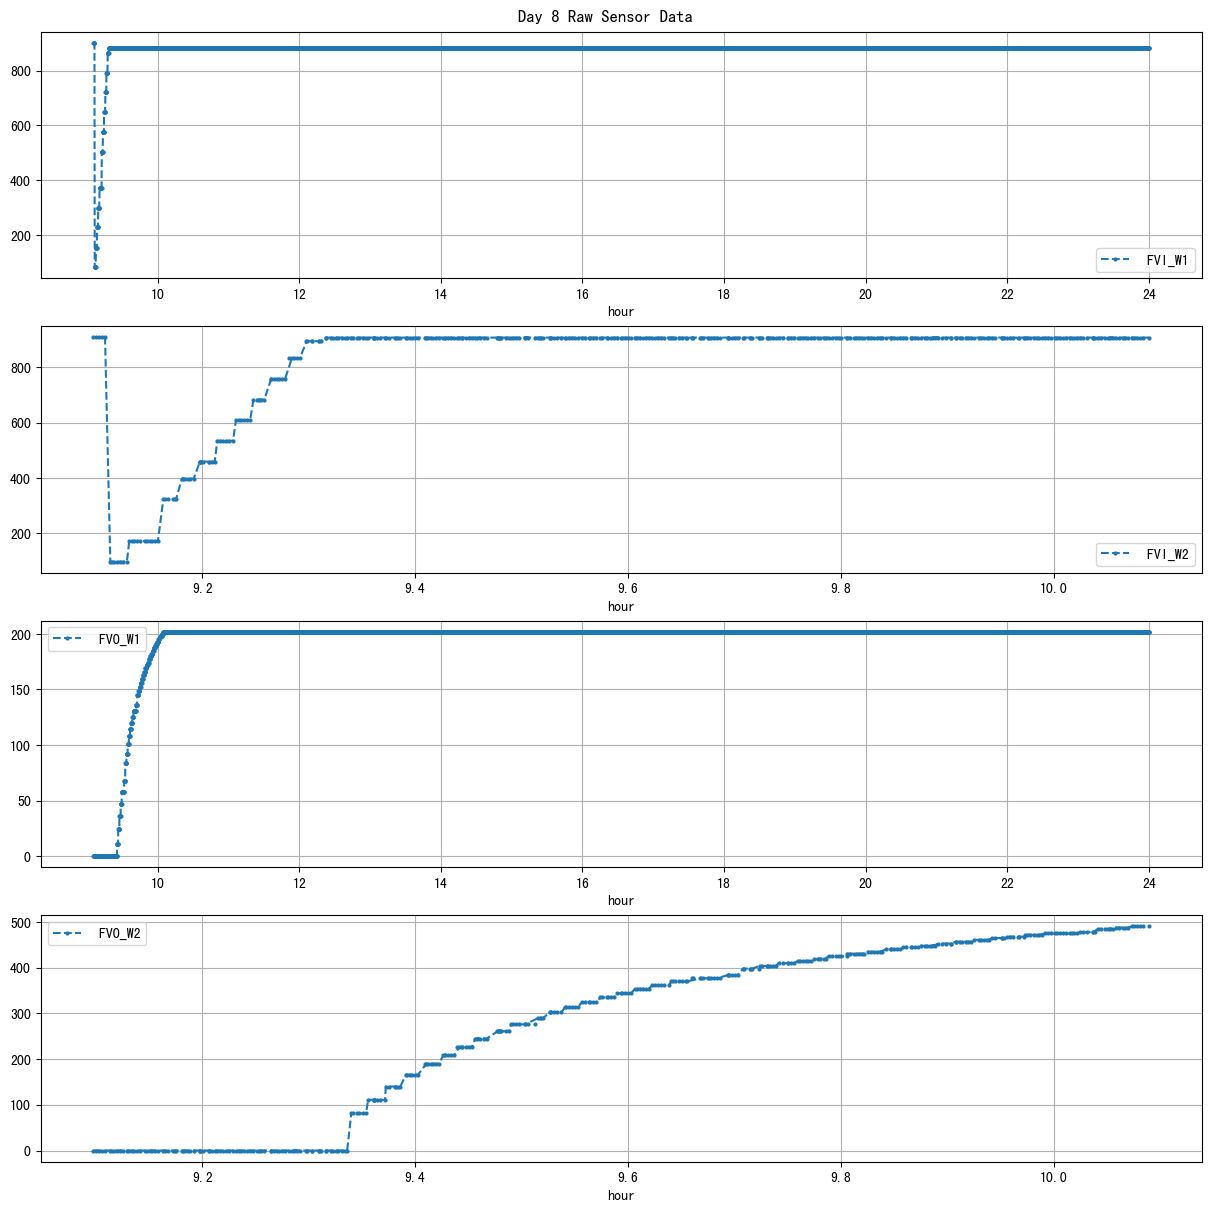
| 2026-03-09 09:05:01+08:00 | 8 | 545 | Ws_W1 | 0.950327 | 60 | 545.02 | 544.5 | 557.72 | 557.916667 | 17647.0 | 18596.0 | 762 | 0.0 | -1.183371 | -0.161008 | 1.462733 | 1.245407 | 949.0 | True | -31.2 | 11.8 | 949.0 | 0.0 | 349.869795 | 349.869795 | 2840 | 176 | -1.267865 | 18246.130205 | 881.0 | 202.0 | NaN | NaN |
| ws_name | num_dp | num_nan_raw | num_nan_final | num_spike | cum_step_adj |
|---|---|---|---|---|---|
| Ws_W2 | 17,271 | 15,468 | 0 | 26 | 27.62 |
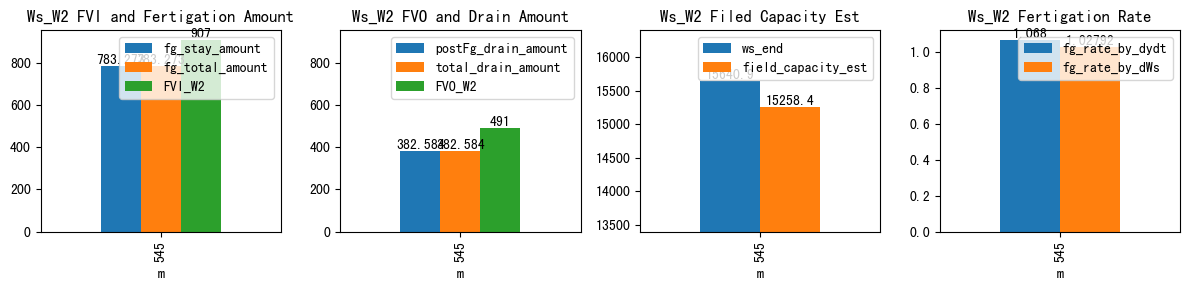
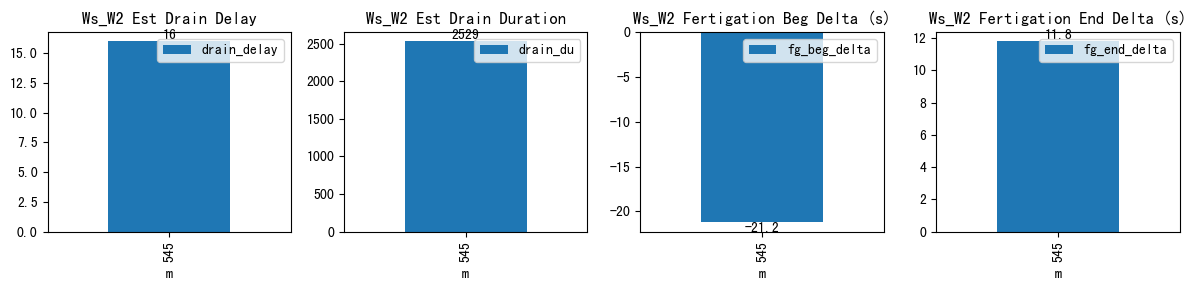
| ds | d | m | ws_name | prominence_cut | max_drain_du | fg_beg | fg_beg_est | fg_end | fg_end_est | ws_beg | ws_end | duc | pre_fg_et | post_fg_ws | post_drn_et | fg_rate_by_dydt | fg_rate_by_dWs | fg_stay_amount | enough_data | fg_beg_delta | fg_end_delta | fg_total_amount | fg_drain_amount | postFg_drain_amount | total_drain_amount | drain_du | drain_delay | drain_rate | field_capacity_est | FVI_W1 | FVO_W1 | FVI_W2 | FVO_W2 |
|---|---|---|---|---|---|---|---|---|---|---|---|---|---|---|---|---|---|---|---|---|---|---|---|---|---|---|---|---|---|---|---|---|---|
| 2026-03-09 09:05:01+08:00 | 8 | 545 | Ws_W2 | 1.037901 | 60 | 545.02 | 544.666667 | 557.72 | 557.916667 | 14857.666667 | 15640.939394 | 762 | 0.0 | -1.517511 | -0.170899 | 1.068 | 1.027917 | 783.272727 | True | -21.2 | 11.8 | 783.272727 | 0.0 | 382.583874 | 382.583874 | 2529 | 16 | -1.617463 | 15258.35552 | NaN | NaN | 907.0 | 491.0 |