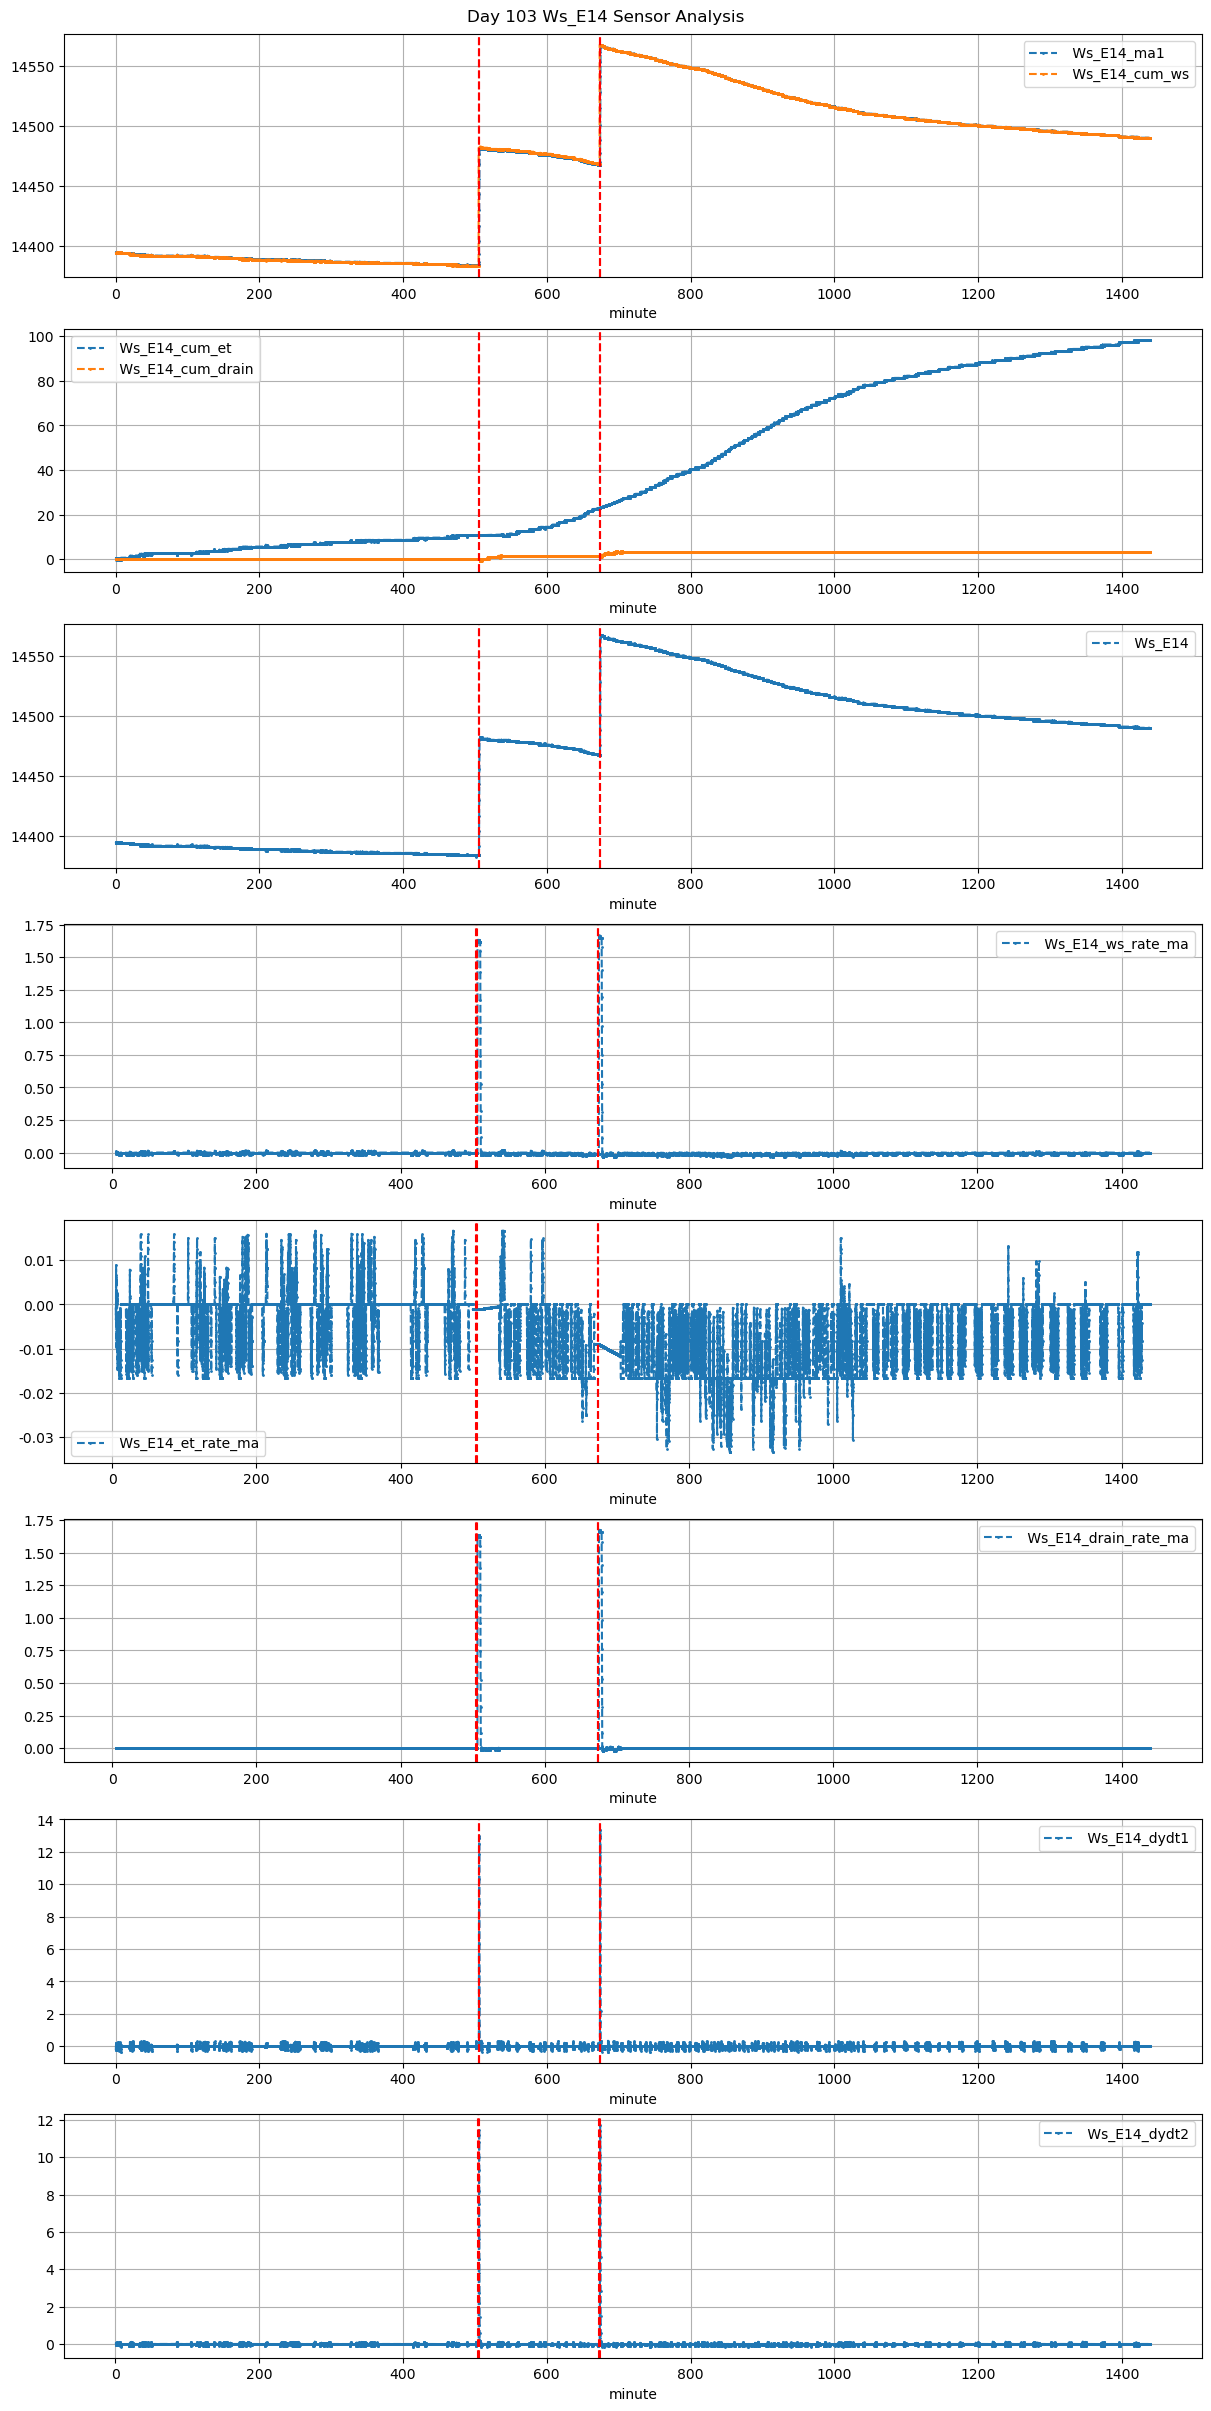
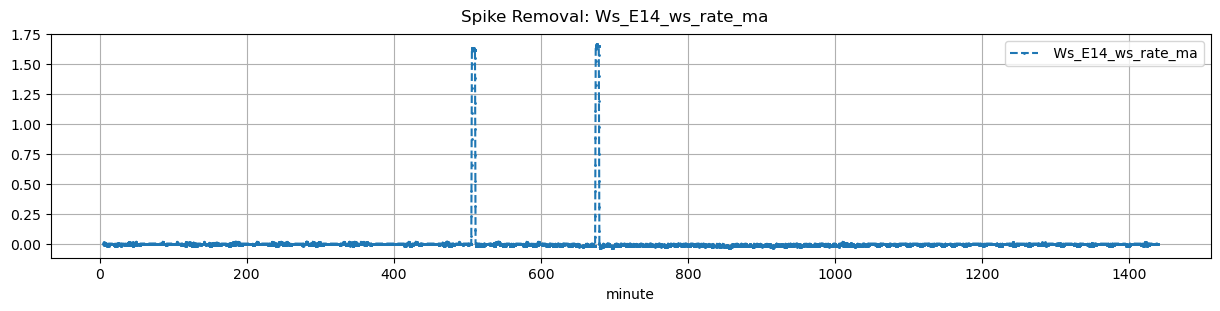
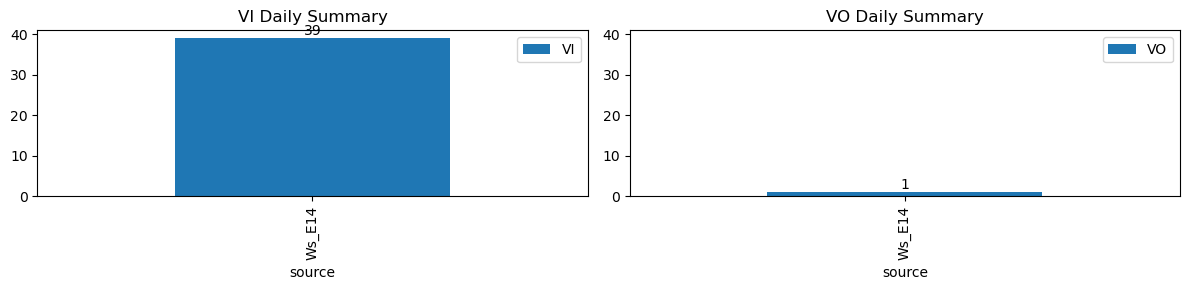
VI and VO Daily Summary
| ws_name | total_dp | nan_dp | nan_filled_dp | long_gap_dp | num_spike |
|---|---|---|---|---|---|
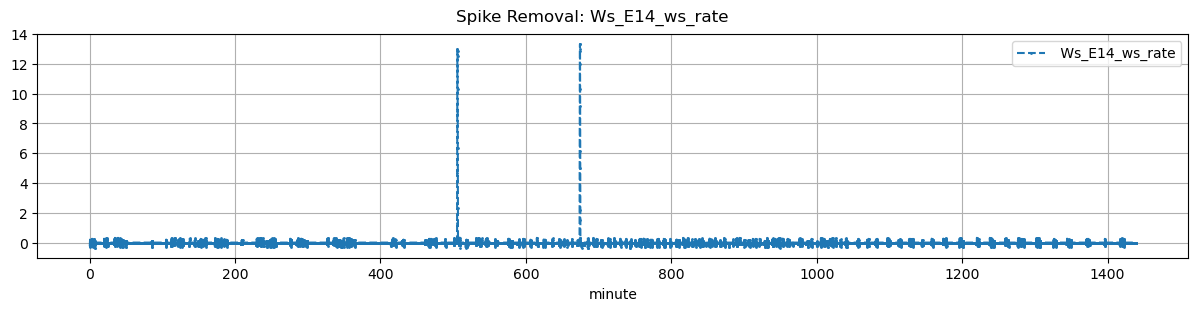
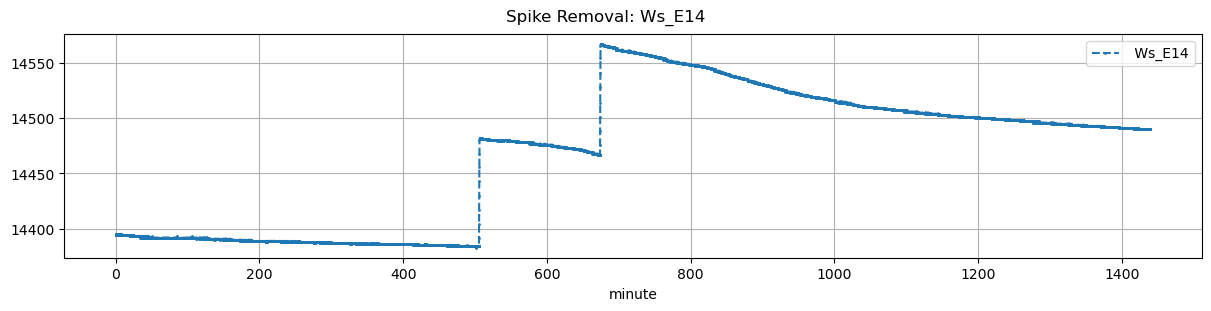
| Ws_E14 | 17271 | 0 | 14630 | 0 | 0 |
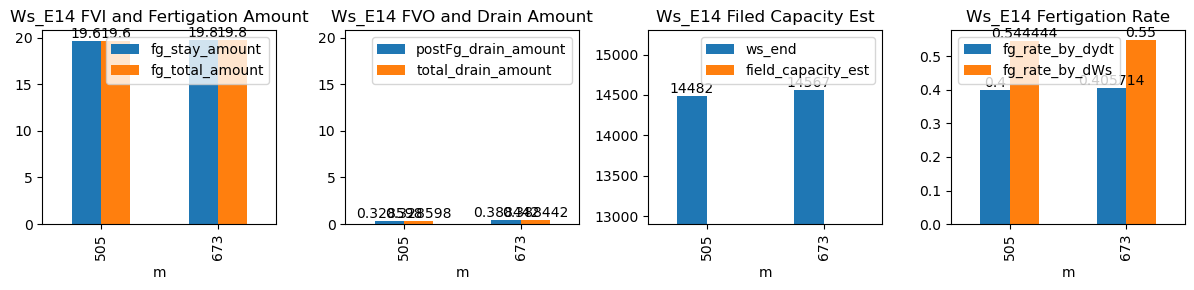
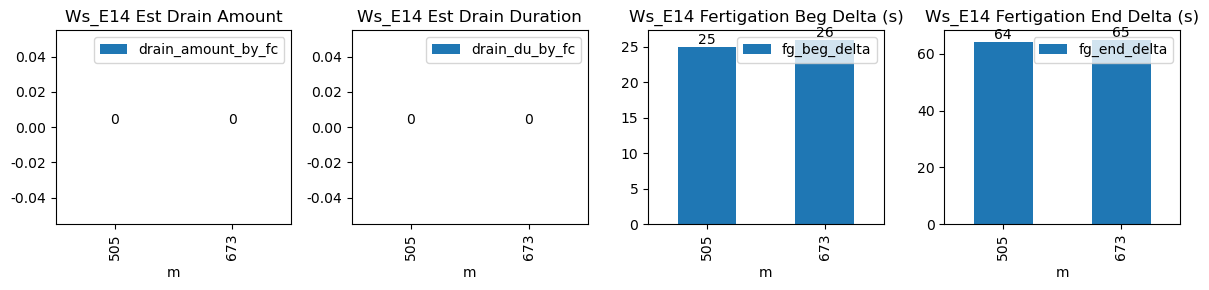
| ds | d | m | ws_name | prominence_cut | max_drain_du | fg_beg | fg_beg_est | fg_end | fg_end_est | drain_amount_by_fc | drain_du_by_fc | drain_rate_by_fc | ws_beg | ws_end | duc | pre_fg_et | post_fg_ws | post_drn_et | fg_rate_by_dydt | fg_rate_by_dWs | fg_stay_amount | fg_beg_delta | fg_end_delta | fg_total_amount | fg_drain_amount | postFg_drain_amount | field_capacity_est | total_drain_amount |
|---|---|---|---|---|---|---|---|---|---|---|---|---|---|---|---|---|---|---|---|---|---|---|---|---|---|---|---|---|
| 2026-01-17 08:25:00+08:00 | 103 | 505 | Ws_E14 | 0.138679 | 30 | 505.0 | 505.416667 | 505.6 | 506.666667 | NaN | NaN | NaN | 14384.0 | 14482.0 | 36 | -0.001130 | -0.006389 | -0.000417 | 0.400000 | 0.544444 | 19.6 | 25.0 | 64.0 | 19.6 | 0.0 | 0.328598 | NaN | 0.328598 |
| 2026-01-17 11:13:24+08:00 | 103 | 673 | Ws_E14 | 0.138679 | 30 | 673.4 | 673.833333 | 674.0 | 675.083333 | NaN | NaN | NaN | 14468.0 | 14567.0 | 36 | -0.009028 | -0.021528 | -0.011667 | 0.405714 | 0.550000 | 19.8 | 26.0 | 65.0 | 19.8 | 0.0 | 0.388442 | NaN | 0.388442 |