| 2026-01-18 08:08:25+08:00 |
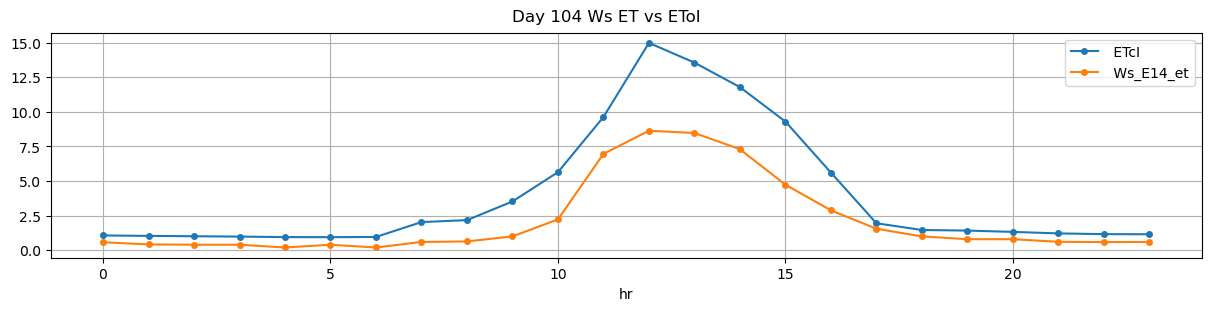
104 |
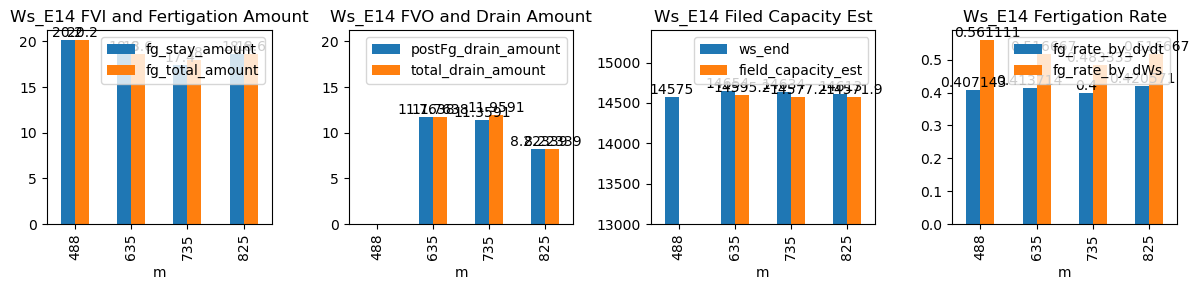
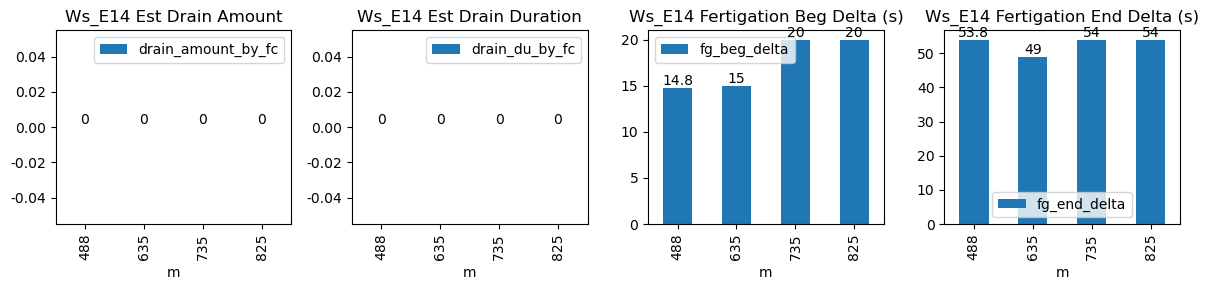
488 |
Ws_E14 |
0.48808 |
30 |
488.42 |
488.666667 |
489.02 |
489.916667 |
NaN |
NaN |
NaN |
14474.0 |
14575.0 |
36 |
0.000000 |
-0.010417 |
-0.012083 |
0.407143 |
0.561111 |
20.2 |
14.8 |
53.8 |
20.2 |
0.0 |
-0.213551 |
NaN |
-0.213551 |
| 2026-01-18 10:35:00+08:00 |
104 |
635 |
Ws_E14 |
0.48808 |
30 |
635.00 |
635.250000 |
635.60 |
636.416667 |
NaN |
NaN |
NaN |
14561.0 |
14654.0 |
36 |
-0.020410 |
-0.385694 |
-0.014097 |
0.413714 |
0.516667 |
18.6 |
15.0 |
49.0 |
18.6 |
0.0 |
11.763769 |
14595.181155 |
11.763769 |
| 2026-01-18 12:15:00+08:00 |
104 |
735 |
Ws_E14 |
0.48808 |
30 |
735.00 |
735.333333 |
735.60 |
736.500000 |
NaN |
NaN |
NaN |
14547.0 |
14634.0 |
36 |
-0.061864 |
-0.454722 |
-0.051944 |
0.400000 |
0.483333 |
17.4 |
20.0 |
54.0 |
18.0 |
0.6 |
11.359129 |
14577.204357 |
11.959129 |
| 2026-01-18 13:45:00+08:00 |
104 |
825 |
Ws_E14 |
0.48808 |
30 |
825.00 |
825.333333 |
825.60 |
826.500000 |
NaN |
NaN |
NaN |
14520.0 |
14613.0 |
36 |
-0.068059 |
-0.371389 |
-0.058611 |
0.420571 |
0.516667 |
18.6 |
20.0 |
54.0 |
18.6 |
0.0 |
8.223392 |
14571.883039 |
8.223392 |