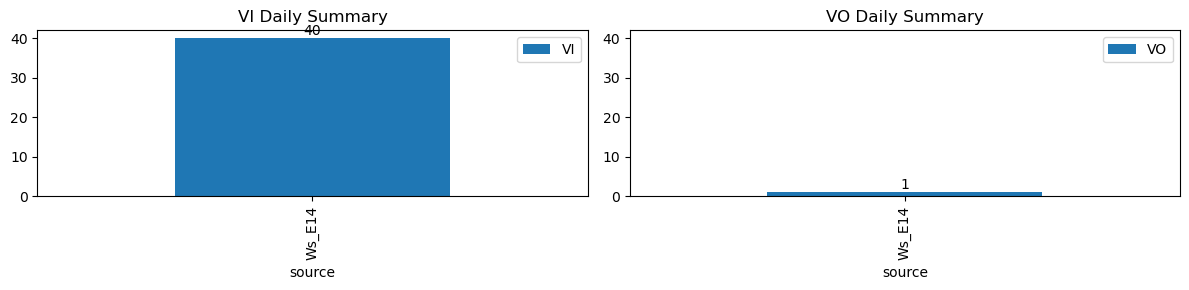
VI and VO Daily Summary
| ws_name | total_dp | nan_dp | nan_filled_dp | long_gap_dp | num_spike |
|---|---|---|---|---|---|
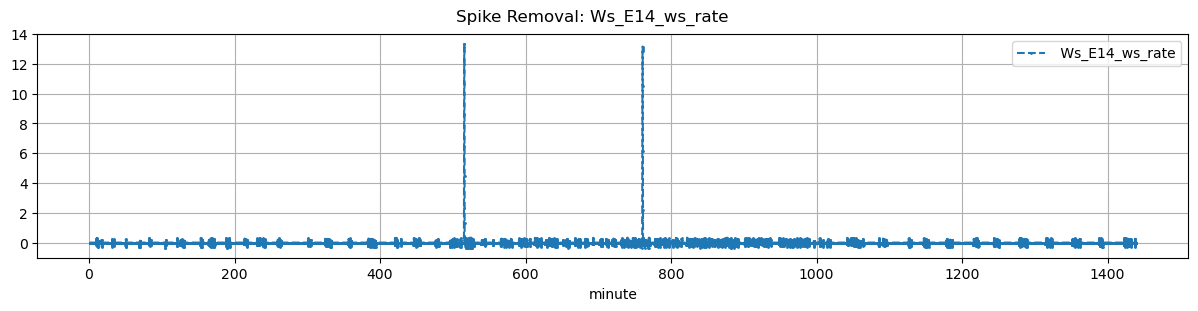
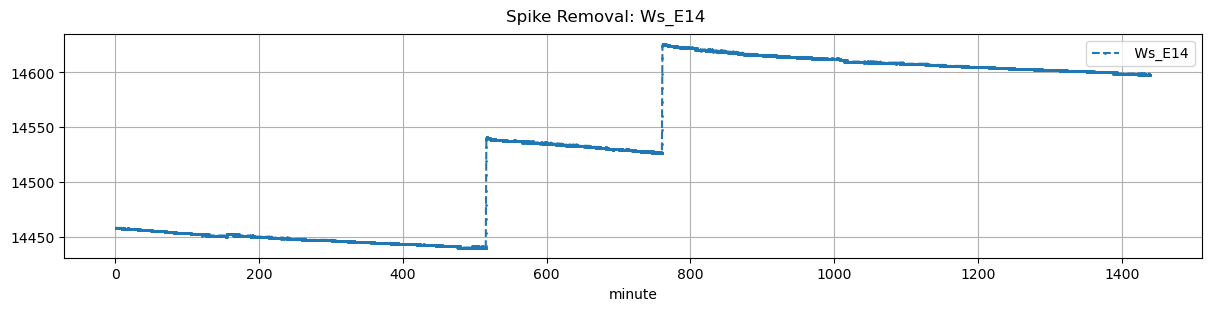
| Ws_E14 | 17262 | 0 | 14499 | 0 | 0 |
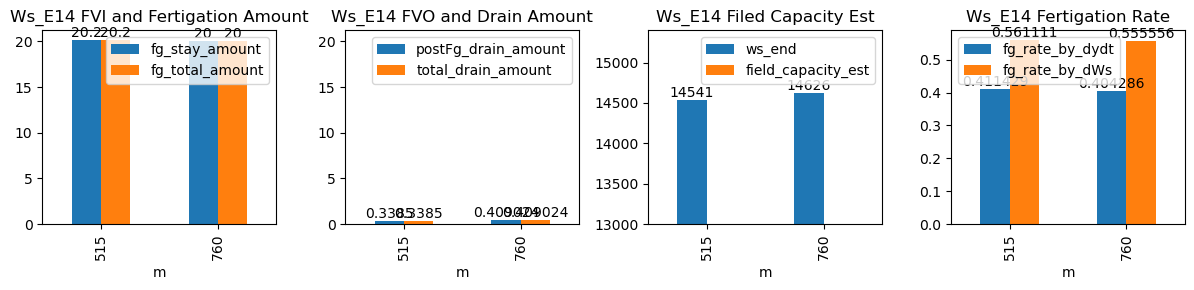
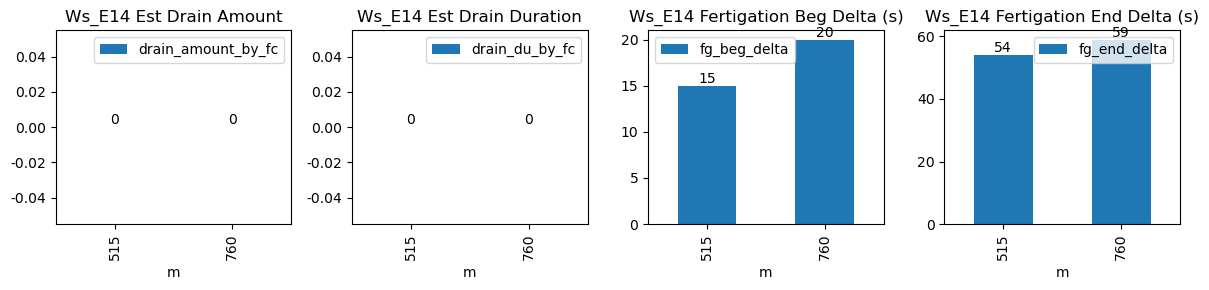
| ds | d | m | ws_name | prominence_cut | max_drain_du | fg_beg | fg_beg_est | fg_end | fg_end_est | drain_amount_by_fc | drain_du_by_fc | drain_rate_by_fc | ws_beg | ws_end | duc | pre_fg_et | post_fg_ws | post_drn_et | fg_rate_by_dydt | fg_rate_by_dWs | fg_stay_amount | fg_beg_delta | fg_end_delta | fg_total_amount | fg_drain_amount | postFg_drain_amount | field_capacity_est | total_drain_amount |
|---|---|---|---|---|---|---|---|---|---|---|---|---|---|---|---|---|---|---|---|---|---|---|---|---|---|---|---|---|
| 2026-01-19 08:35:00+08:00 | 105 | 515 | Ws_E14 | 0.136993 | 30 | 515.0 | 515.250000 | 515.6 | 516.500000 | NaN | NaN | NaN | 14440.0 | 14541.0 | 36 | 0.000000 | -0.019028 | -0.006667 | 0.411429 | 0.561111 | 20.2 | 15.0 | 54.0 | 20.2 | 0.0 | 0.338500 | NaN | 0.338500 |
| 2026-01-19 12:40:00+08:00 | 105 | 760 | Ws_E14 | 0.136993 | 30 | 760.0 | 760.333333 | 760.6 | 761.583333 | NaN | NaN | NaN | 14526.0 | 14626.0 | 36 | -0.001571 | -0.015694 | -0.004931 | 0.404286 | 0.555556 | 20.0 | 20.0 | 59.0 | 20.0 | 0.0 | 0.409024 | NaN | 0.409024 |