| 2026-01-09 11:17:08+08:00 |
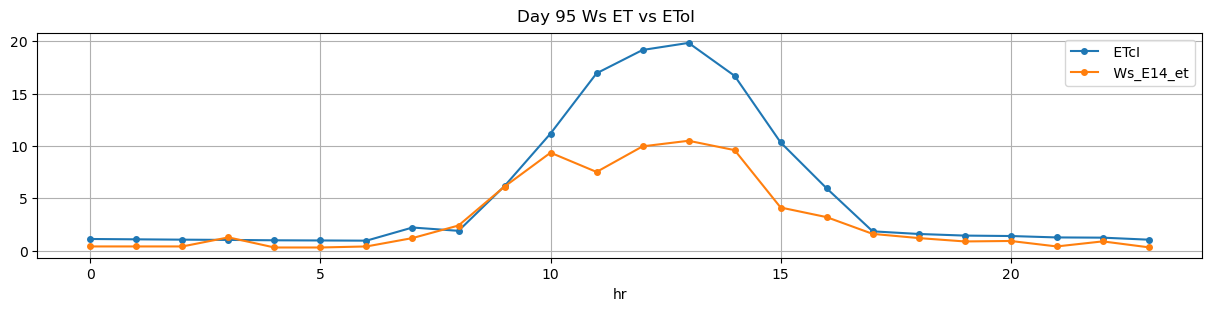
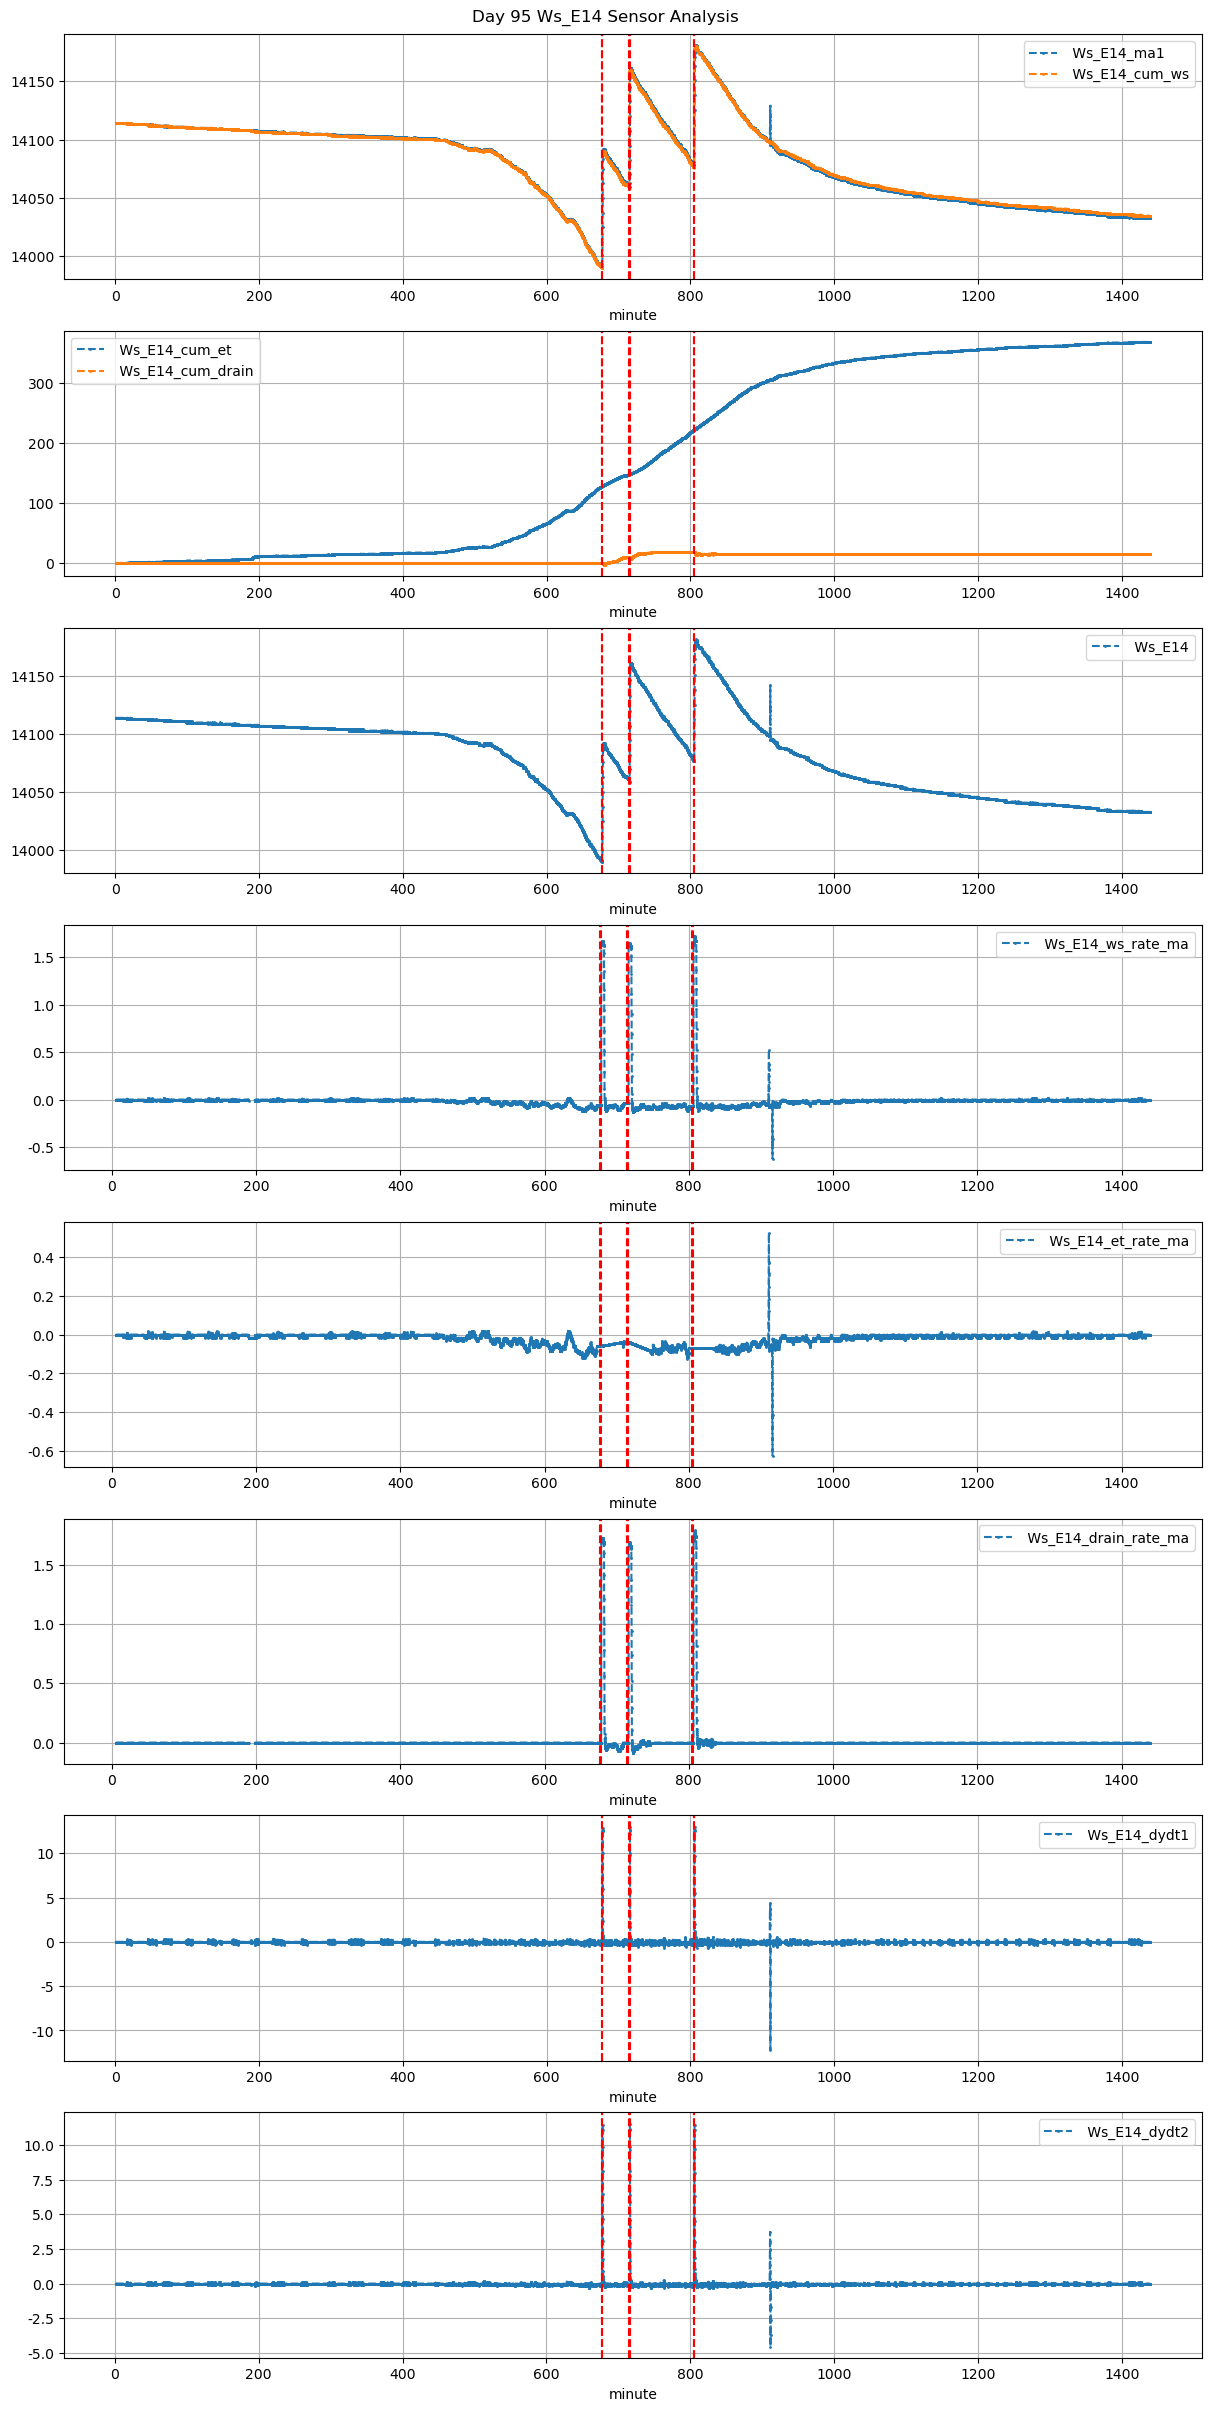
95 |
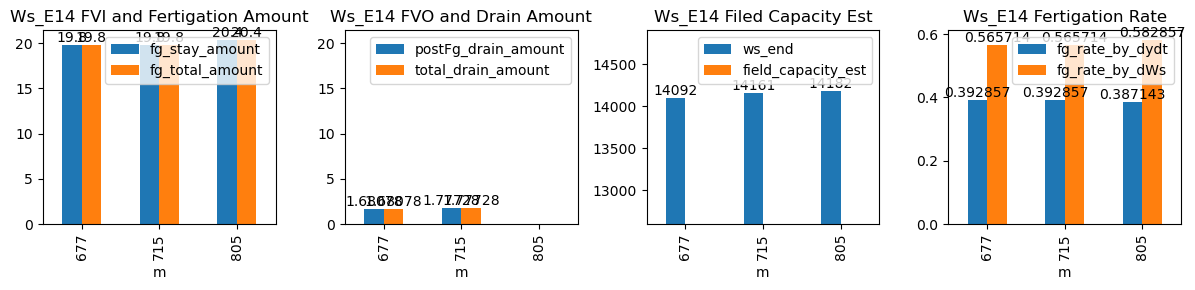
677 |
Ws_E14 |
0.419912 |
30 |
677.13 |
677.416667 |
677.71 |
678.666667 |
NaN |
NaN |
NaN |
13993.0 |
14092.0 |
35 |
-0.058333 |
-0.095000 |
-0.038083 |
0.392857 |
0.565714 |
19.8 |
17.2 |
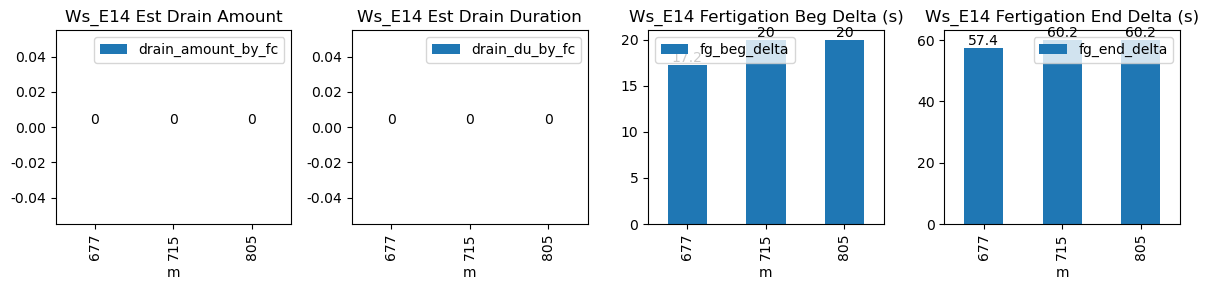
57.4 |
19.8 |
0.0 |
1.680784 |
NaN |
1.680784 |
| 2026-01-09 11:55:00+08:00 |
95 |
715 |
Ws_E14 |
0.419912 |
30 |
715.00 |
715.333333 |
715.58 |
716.583333 |
NaN |
NaN |
NaN |
14062.0 |
14161.0 |
35 |
-0.038277 |
-0.108889 |
-0.083228 |
0.392857 |
0.565714 |
19.8 |
20.0 |
60.2 |
19.8 |
0.0 |
1.777278 |
NaN |
1.777278 |
| 2026-01-09 13:25:00+08:00 |
95 |
805 |
Ws_E14 |
0.419912 |
30 |
805.00 |
805.333333 |
805.58 |
806.583333 |
NaN |
NaN |
NaN |
14080.0 |
14182.0 |
35 |
-0.082627 |
-0.071250 |
-0.071898 |
0.387143 |
0.582857 |
20.4 |
20.0 |
60.2 |
20.4 |
0.0 |
-0.457086 |
NaN |
-0.457086 |