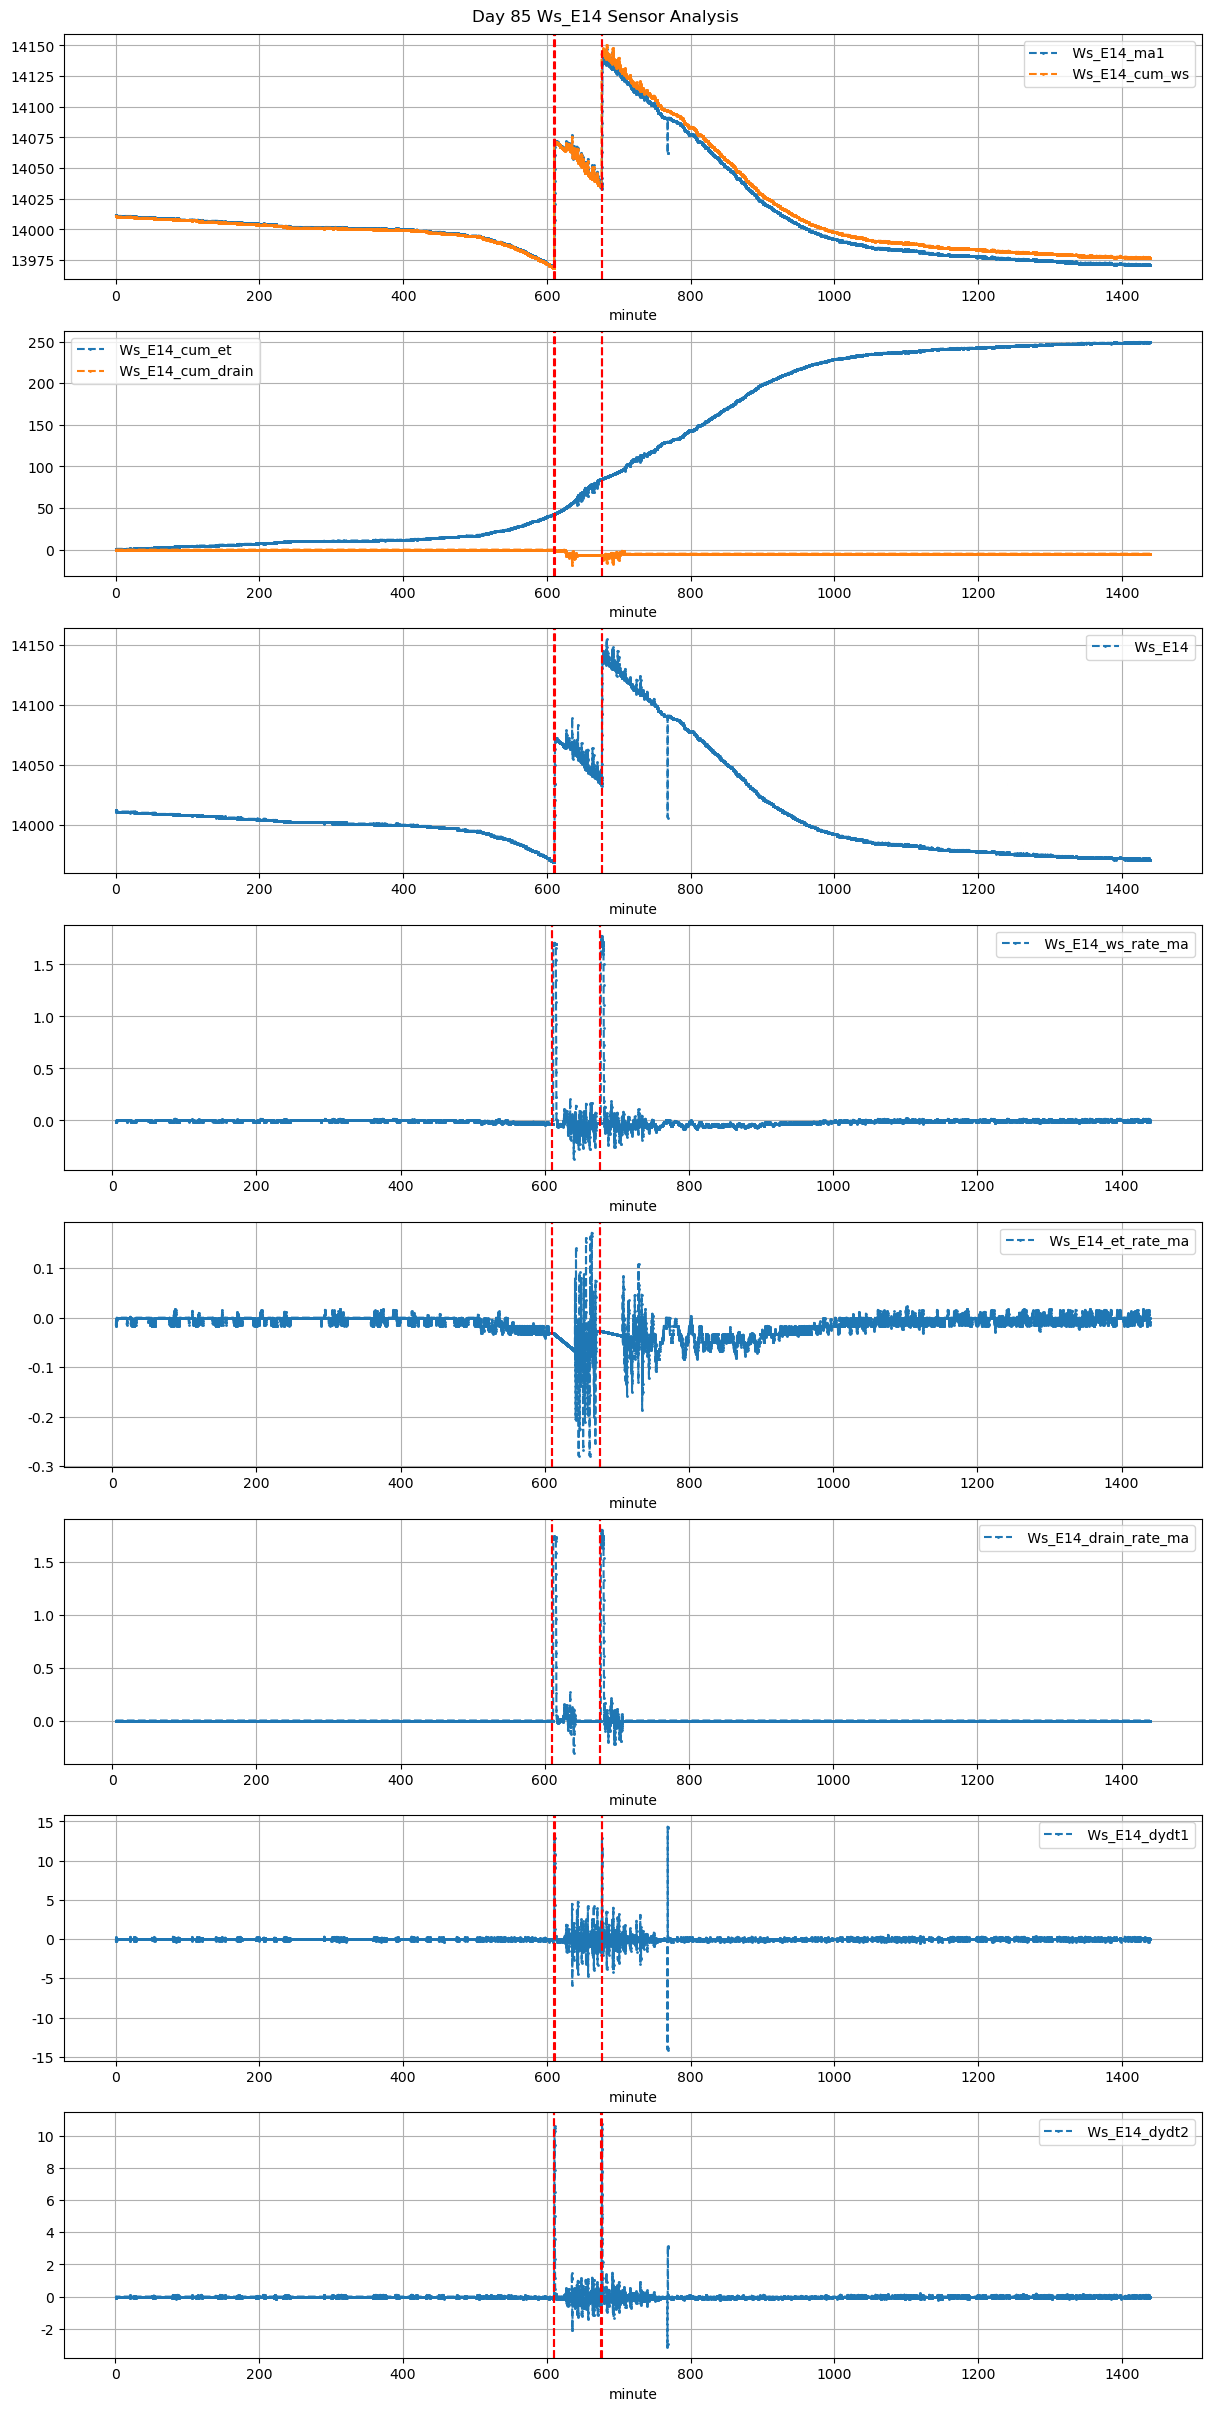
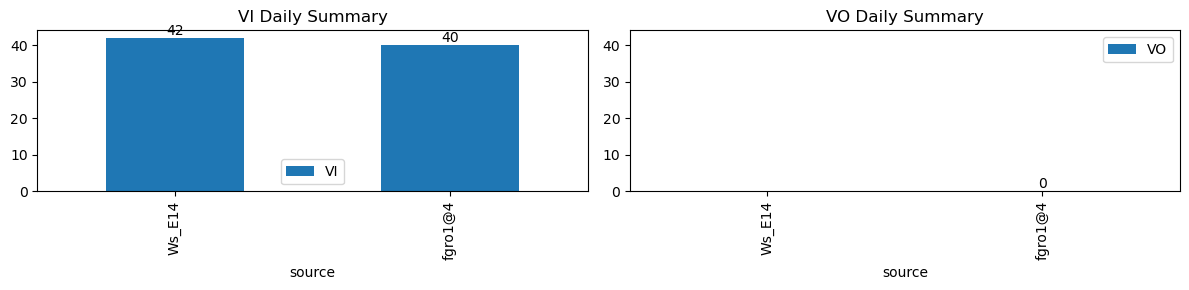
VI and VO Daily Summary
| ws_name | total_dp | nan_dp | nan_filled_dp | long_gap_dp | num_spike |
|---|---|---|---|---|---|
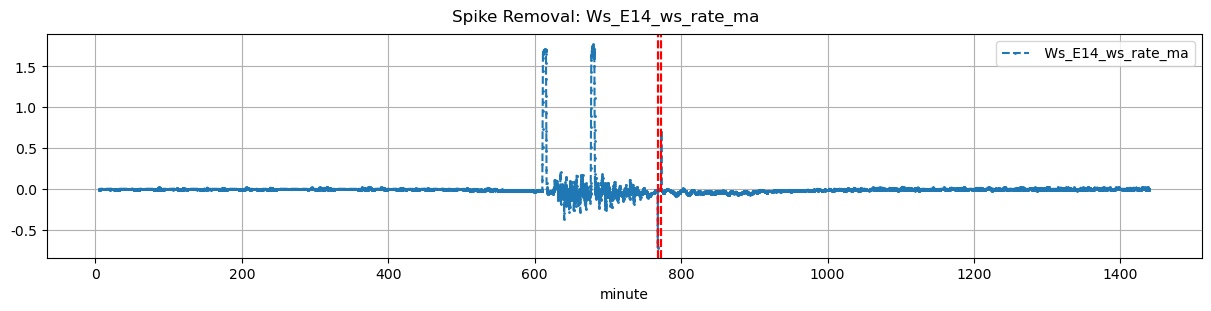
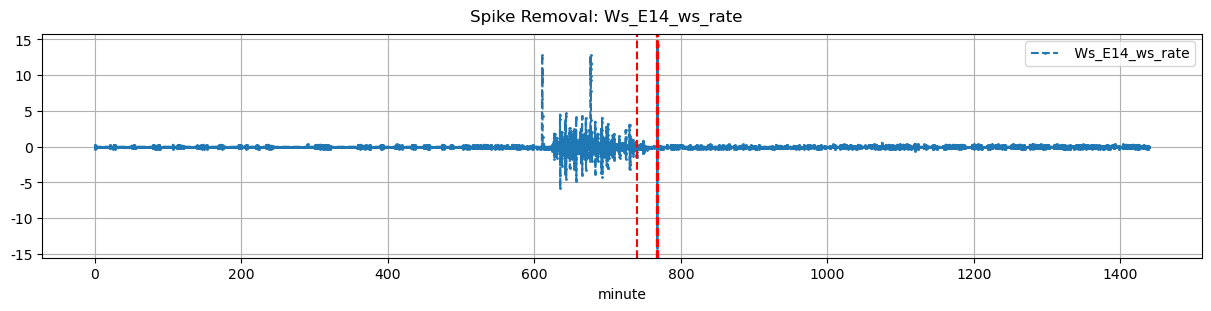
| Ws_E14 | 17271 | 0 | 13594 | 0 | 2 |
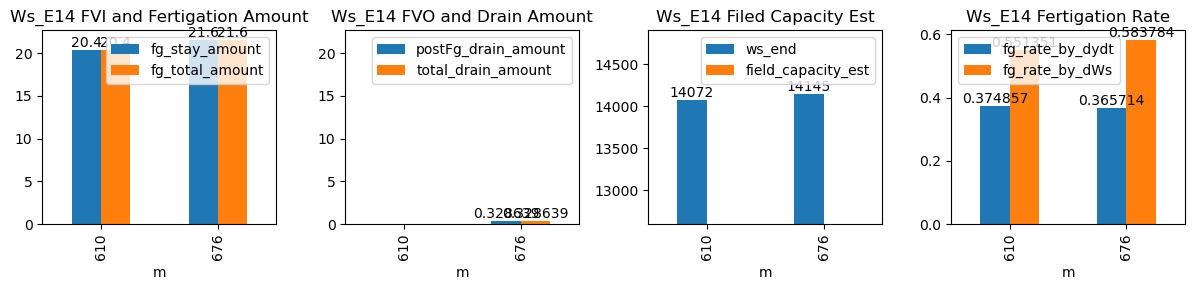
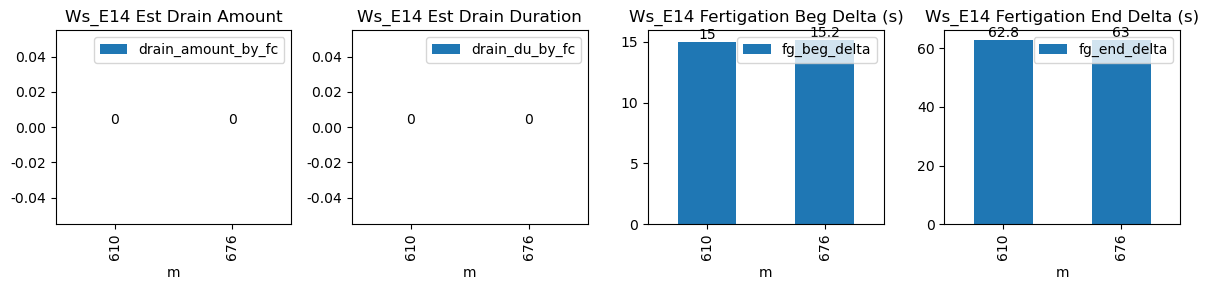
| ds | d | m | ws_name | prominence_cut | max_drain_du | fg_beg | fg_beg_est | fg_end | fg_end_est | drain_amount_by_fc | drain_du_by_fc | drain_rate_by_fc | ws_beg | ws_end | duc | pre_fg_et | post_fg_ws | post_drn_et | fg_rate_by_dydt | fg_rate_by_dWs | fg_stay_amount | fg_beg_delta | fg_end_delta | fg_total_amount | fg_drain_amount | postFg_drain_amount | field_capacity_est | total_drain_amount |
|---|---|---|---|---|---|---|---|---|---|---|---|---|---|---|---|---|---|---|---|---|---|---|---|---|---|---|---|---|
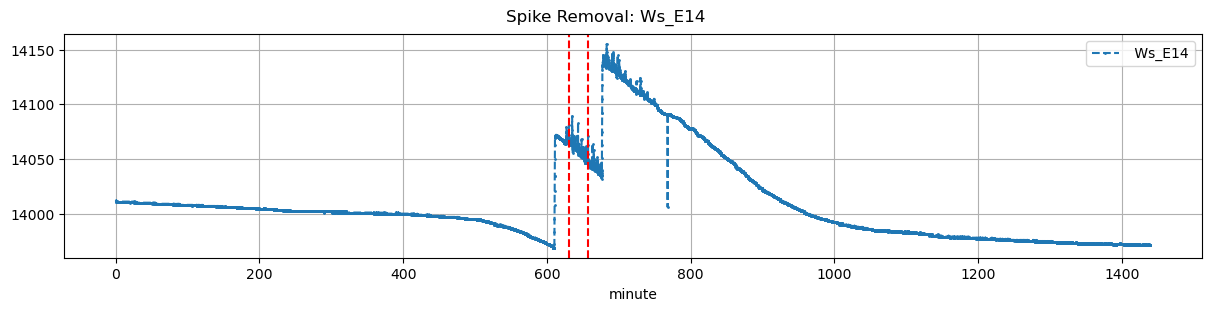
| 2025-12-30 10:10:00+08:00 | 85 | 610 | Ws_E14 | 0.503708 | 30 | 610.00 | 610.250000 | 610.62 | 611.666667 | NaN | NaN | NaN | 13970.0 | 14072.0 | 37 | -0.031215 | -0.047361 | -0.067083 | 0.374857 | 0.551351 | 20.4 | 15.0 | 62.8 | 20.4 | 0.0 | -1.142457 | NaN | -1.142457 |
| 2025-12-30 11:16:05+08:00 | 85 | 676 | Ws_E14 | 0.503708 | 30 | 676.08 | 676.333333 | 676.70 | 677.750000 | NaN | NaN | NaN | 14037.0 | 14145.0 | 37 | -0.066667 | -0.026806 | -0.036667 | 0.365714 | 0.583784 | 21.6 | 15.2 | 63.0 | 21.6 | 0.0 | 0.328639 | NaN | 0.328639 |