| 2025-12-31 09:50:00+08:00 |
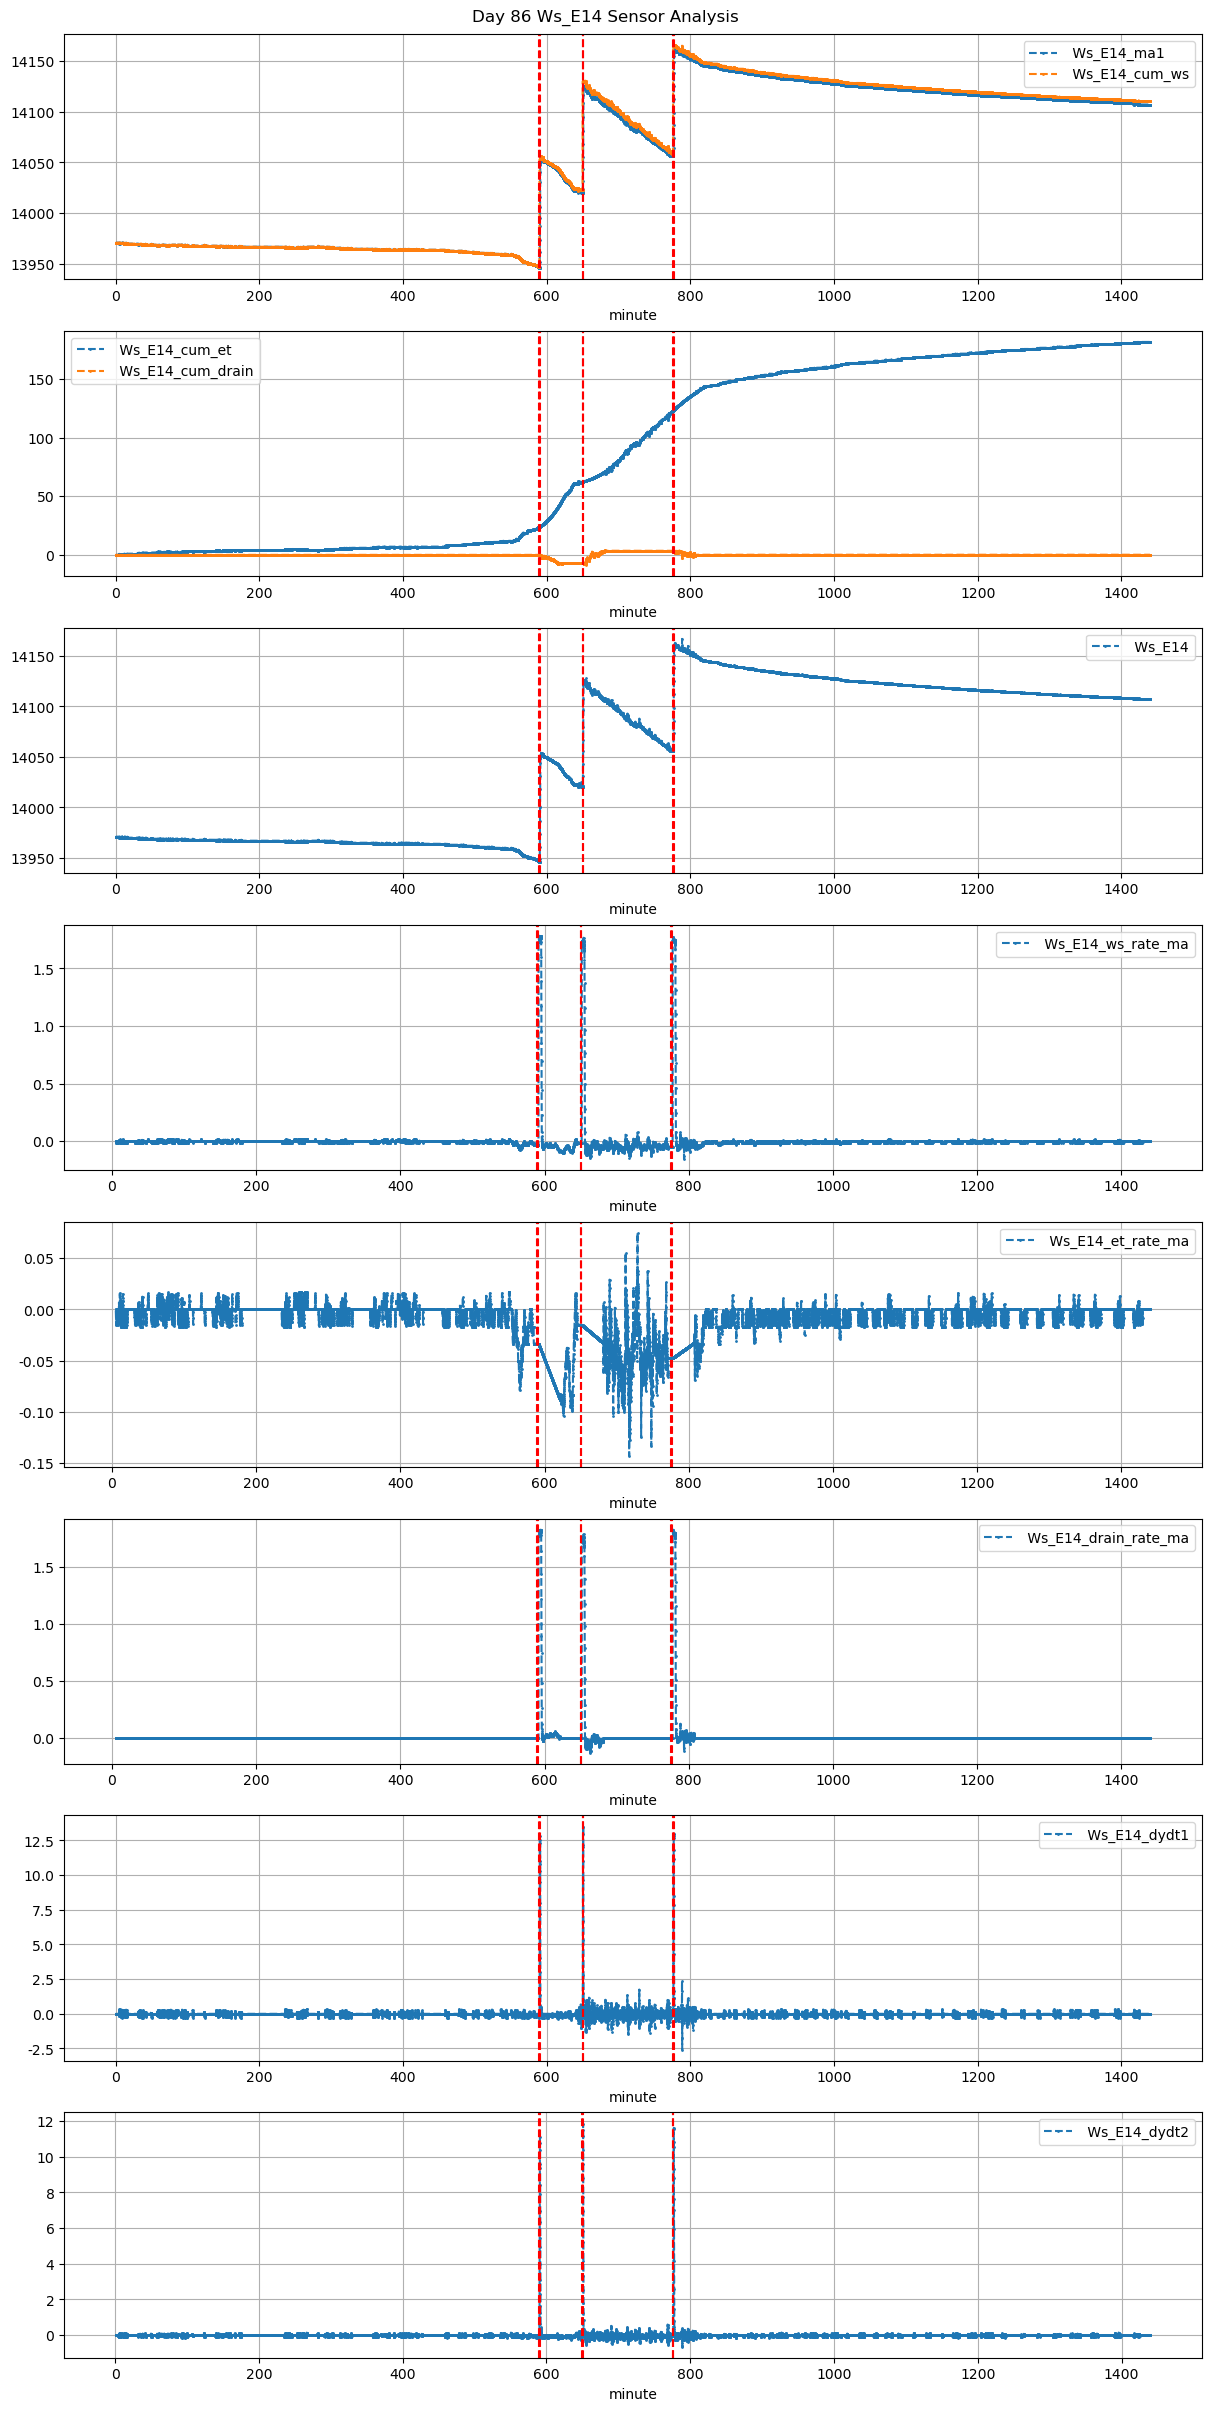
86 |
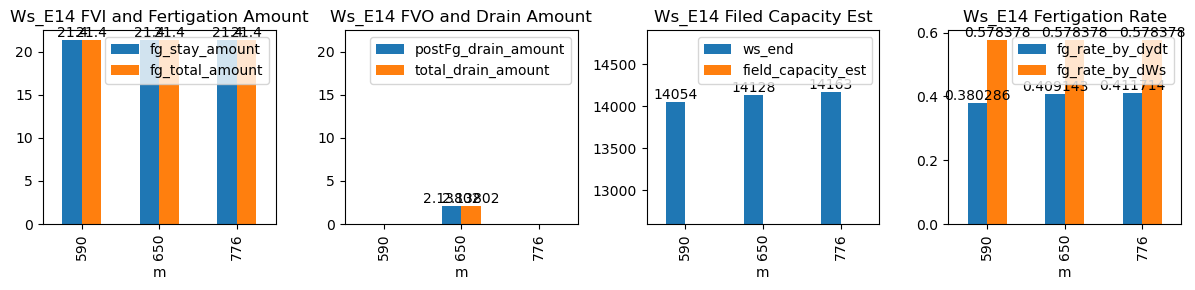
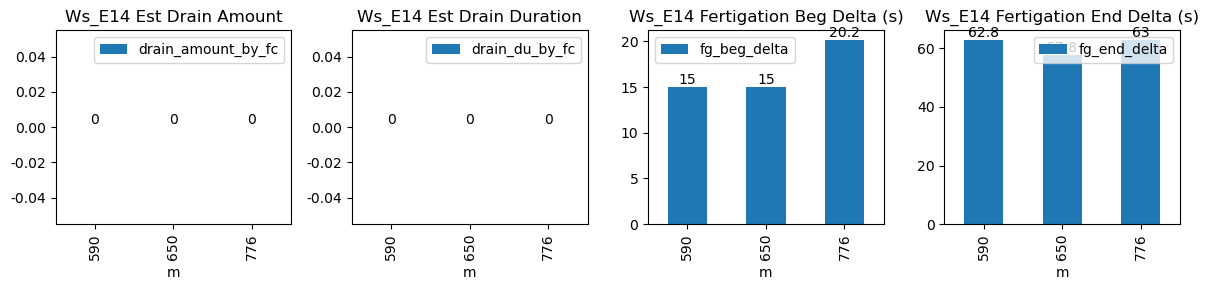
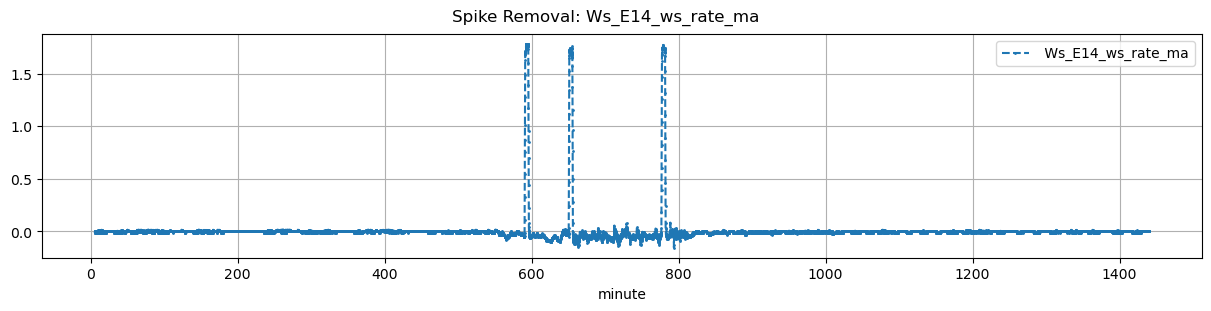
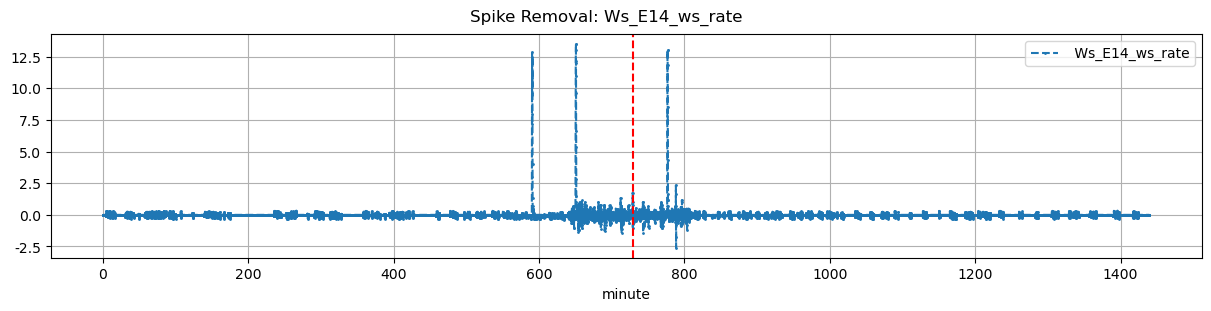
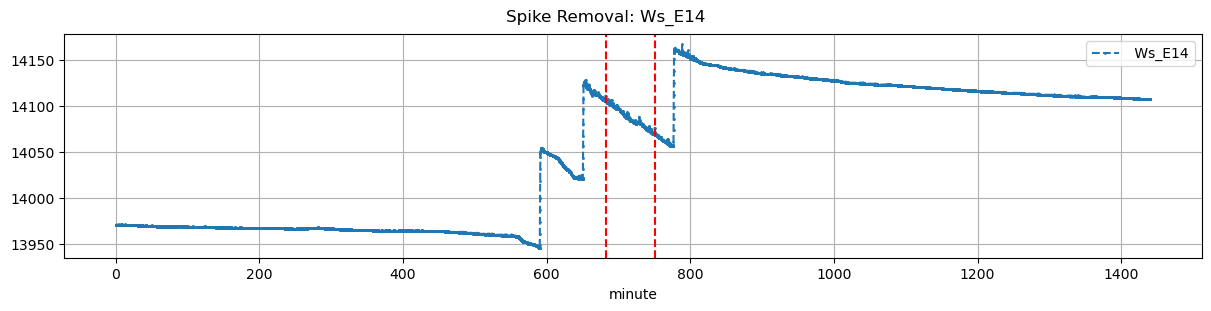
590 |
Ws_E14 |
0.246695 |
30 |
590.00 |
590.250000 |
590.62 |
591.666667 |
NaN |
NaN |
NaN |
13947.0 |
14054.0 |
37 |
-0.033333 |
-0.044722 |
-0.088750 |
0.380286 |
0.578378 |
21.4 |
15.0 |
62.8 |
21.4 |
0.0 |
-1.501776 |
NaN |
-1.501776 |
| 2025-12-31 10:50:00+08:00 |
86 |
650 |
Ws_E14 |
0.246695 |
30 |
650.00 |
650.250000 |
650.62 |
651.583333 |
NaN |
NaN |
NaN |
14021.0 |
14128.0 |
37 |
-0.014851 |
-0.075278 |
-0.032847 |
0.409143 |
0.578378 |
21.4 |
15.0 |
57.8 |
21.4 |
0.0 |
2.138021 |
NaN |
2.138021 |
| 2025-12-31 12:56:05+08:00 |
86 |
776 |
Ws_E14 |
0.246695 |
30 |
776.08 |
776.416667 |
776.70 |
777.750000 |
NaN |
NaN |
NaN |
14056.0 |
14163.0 |
37 |
-0.055972 |
-0.047500 |
-0.032454 |
0.411714 |
0.578378 |
21.4 |
20.2 |
63.0 |
21.4 |
0.0 |
-0.881385 |
NaN |
-0.881385 |